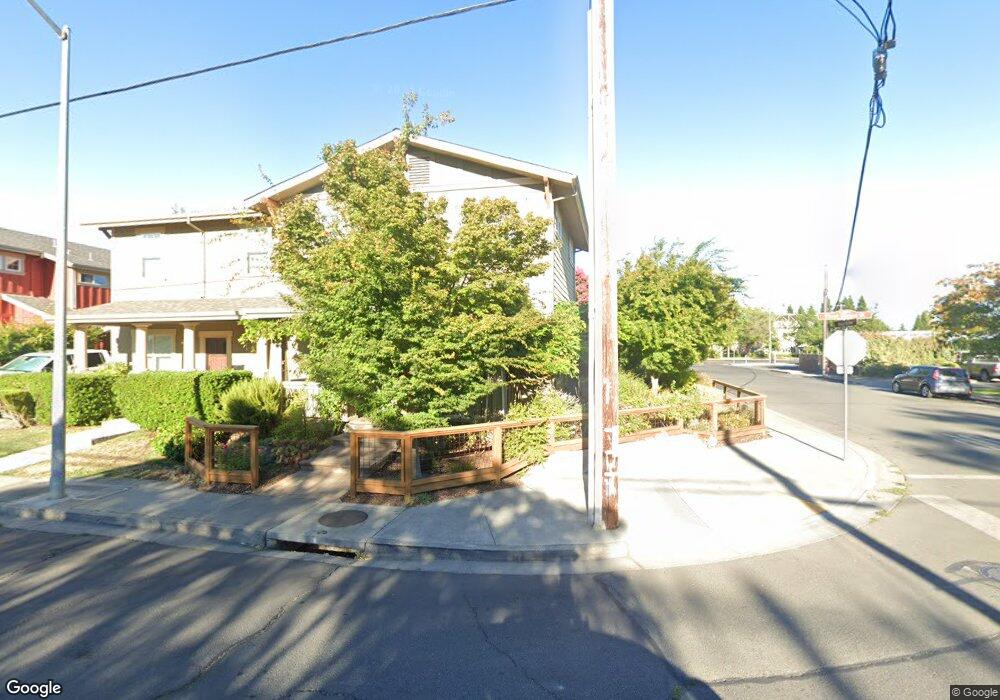
990 1st St W Unkn Sonoma, CA 95476
Estimated Value: $540,000 - $804,000
3
Beds
2
Baths
1,124
Sq Ft
$623/Sq Ft
Est. Value
About This Home
This home is located at 990 1st St W Unkn, Sonoma, CA 95476 and is currently estimated at $699,847, approximately $622 per square foot. 990 1st St W Unkn is a home located in Sonoma County with nearby schools including Prestwood Elementary School, Adele Harrison Middle School, and Creekside High School.
Ownership History
Date
Name
Owned For
Owner Type
Purchase Details
Closed on
Aug 16, 2024
Sold by
Janet Engelbrecht Trust and Engelbrecht Janet
Bought by
Marroquin Rene Alejandro Me and Marroquin Alondra
Current Estimated Value
Purchase Details
Closed on
Feb 5, 2015
Sold by
Harvey Dolores
Bought by
Engelbrecht Janet and Janet Engelbrecht Trust
Purchase Details
Closed on
Jul 22, 2005
Sold by
Harvey Carlos
Bought by
Harvey Dolores
Home Financials for this Owner
Home Financials are based on the most recent Mortgage that was taken out on this home.
Original Mortgage
$329,400
Interest Rate
5.56%
Mortgage Type
Fannie Mae Freddie Mac
Purchase Details
Closed on
Jul 14, 2005
Sold by
Sonoma Mulberry Associates Llc
Bought by
Harvey Dolores
Home Financials for this Owner
Home Financials are based on the most recent Mortgage that was taken out on this home.
Original Mortgage
$329,400
Interest Rate
5.56%
Mortgage Type
Fannie Mae Freddie Mac
Create a Home Valuation Report for This Property
The Home Valuation Report is an in-depth analysis detailing your home's value as well as a comparison with similar homes in the area
Home Values in the Area
Average Home Value in this Area
Purchase History
| Date | Buyer | Sale Price | Title Company |
|---|---|---|---|
| Marroquin Rene Alejandro Me | $525,000 | First American Title | |
| Engelbrecht Janet | $421,000 | First American Title Company | |
| Harvey Dolores | -- | Old Republic Title Co | |
| Harvey Dolores | $366,000 | Old Republic Title Co |
Source: Public Records
Mortgage History
| Date | Status | Borrower | Loan Amount |
|---|---|---|---|
| Previous Owner | Harvey Dolores | $329,400 |
Source: Public Records
Tax History Compared to Growth
Tax History
| Year | Tax Paid | Tax Assessment Tax Assessment Total Assessment is a certain percentage of the fair market value that is determined by local assessors to be the total taxable value of land and additions on the property. | Land | Improvement |
|---|---|---|---|---|
| 2025 | $6,901 | $524,800 | $210,000 | $314,800 |
| 2024 | $6,901 | $495,929 | $198,535 | $297,394 |
| 2023 | $6,901 | $486,206 | $194,643 | $291,563 |
| 2022 | $6,610 | $476,674 | $190,827 | $285,847 |
| 2021 | $6,456 | $467,329 | $187,086 | $280,243 |
| 2020 | $6,347 | $462,538 | $185,168 | $277,370 |
| 2019 | $6,205 | $453,470 | $181,538 | $271,932 |
| 2018 | $6,178 | $444,579 | $177,979 | $266,600 |
| 2017 | $6,108 | $435,863 | $174,490 | $261,373 |
| 2016 | $5,644 | $427,318 | $171,069 | $256,249 |
| 2015 | $5,472 | $416,160 | $187,614 | $228,546 |
| 2014 | $5,372 | $408,009 | $183,939 | $224,070 |
Source: Public Records
Map
Nearby Homes