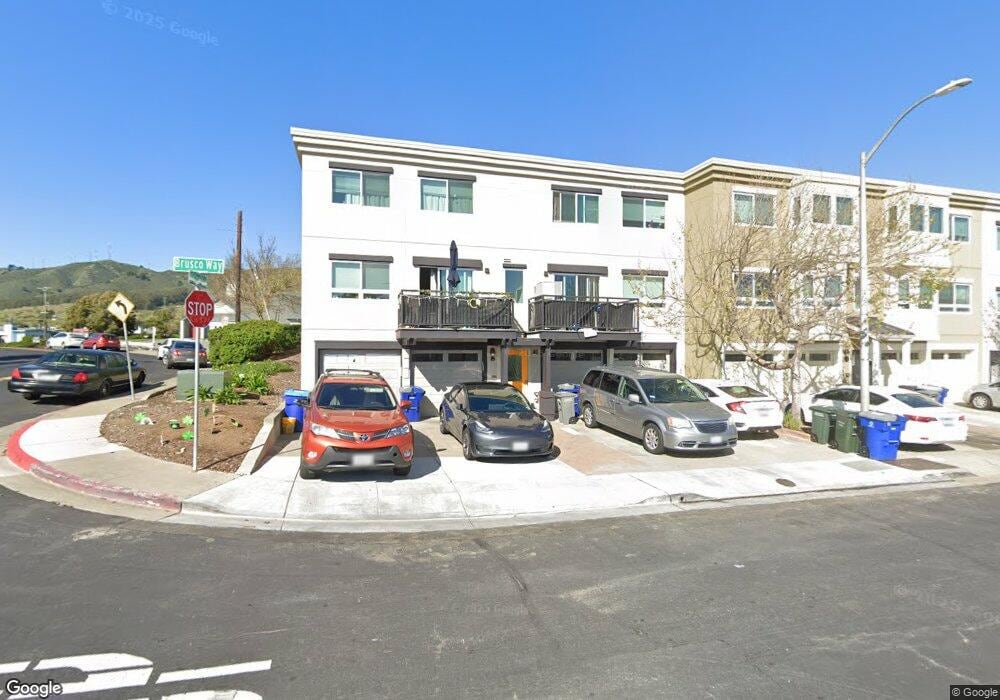
990 Brusco Way South San Francisco, CA 94080
Sunshine Gardens NeighborhoodEstimated Value: $1,906,000 - $2,274,000
8
Beds
8
Baths
4,767
Sq Ft
$440/Sq Ft
Est. Value
About This Home
This home is located at 990 Brusco Way, South San Francisco, CA 94080 and is currently estimated at $2,095,237, approximately $439 per square foot. 990 Brusco Way is a home located in San Mateo County with nearby schools including Sunshine Gardens Elementary School, Parkway Heights Middle School, and El Camino High School.
Ownership History
Date
Name
Owned For
Owner Type
Purchase Details
Closed on
Nov 10, 2021
Sold by
Willow Gardens Housing Associates
Bought by
Mp Willow Greenridge Associates Lp
Current Estimated Value
Home Financials for this Owner
Home Financials are based on the most recent Mortgage that was taken out on this home.
Original Mortgage
$10,447,119
Outstanding Balance
$9,586,213
Interest Rate
3.09%
Estimated Equity
-$7,490,976
Purchase Details
Closed on
Jan 27, 2009
Sold by
Willow Gardens Housing Associates
Bought by
Willow Gardens Housing Associates
Purchase Details
Closed on
Nov 19, 2002
Sold by
Lyons Richard P and Lyons Janet Kay
Bought by
Willow Garden Housing Associates
Create a Home Valuation Report for This Property
The Home Valuation Report is an in-depth analysis detailing your home's value as well as a comparison with similar homes in the area
Home Values in the Area
Average Home Value in this Area
Purchase History
| Date | Buyer | Sale Price | Title Company |
|---|---|---|---|
| Mp Willow Greenridge Associates Lp | $16,000,000 | Old Republic Title | |
| Willow Gardens Housing Associates | -- | First American Title Company | |
| Willow Gardens Housing Associates | -- | First American Title Company | |
| Willow Garden Housing Associates | $750,000 | Fidelity National Title |
Source: Public Records
Mortgage History
| Date | Status | Borrower | Loan Amount |
|---|---|---|---|
| Open | Mp Willow Greenridge Associates Lp | $10,447,119 | |
| Open | Mp Willow Greenridge Associates Lp | $24,037,683 |
Source: Public Records
Tax History Compared to Growth
Tax History
| Year | Tax Paid | Tax Assessment Tax Assessment Total Assessment is a certain percentage of the fair market value that is determined by local assessors to be the total taxable value of land and additions on the property. | Land | Improvement |
|---|---|---|---|---|
| 2025 | $24,160 | $1,984,458 | $912,638 | $1,071,820 |
| 2023 | $24,160 | $1,907,400 | $877,200 | $1,030,200 |
| 2022 | $22,459 | $1,870,000 | $860,000 | $1,010,000 |
| 2021 | $2,753 | $1,003,514 | $501,757 | $501,757 |
| 2020 | $2,701 | $993,226 | $496,613 | $496,613 |
| 2019 | $2,701 | $973,752 | $486,876 | $486,876 |
| 2018 | $2,648 | $954,660 | $477,330 | $477,330 |
| 2017 | $12,366 | $935,942 | $467,971 | $467,971 |
| 2016 | $11,985 | $917,592 | $458,796 | $458,796 |
| 2015 | $11,787 | $903,810 | $451,905 | $451,905 |
| 2014 | $11,594 | $886,106 | $443,053 | $443,053 |
Source: Public Records
Map
Nearby Homes
- 829 Stonegate Dr
- 252 Sequoia Ave
- 728 Cottonwood Ave
- 729 Grand Ave
- 719 Circle Ct
- 69 Windcrest Ln
- 121 Northcrest Dr
- 645 Baden Ave Unit 4
- 25 Windcrest Ln
- 889 Mclellan Dr Unit 302
- 889 Mclellan Dr Unit 205
- 311 Magnolia Ave
- 632 1st Ln
- 577 Miller Ave
- 16 Cymbidium Cir
- 573 Miller Ave
- 0 Indio Dr
- 616 Mayfair Ave
- 553 Diamond Ave
- 431 Beech Ave