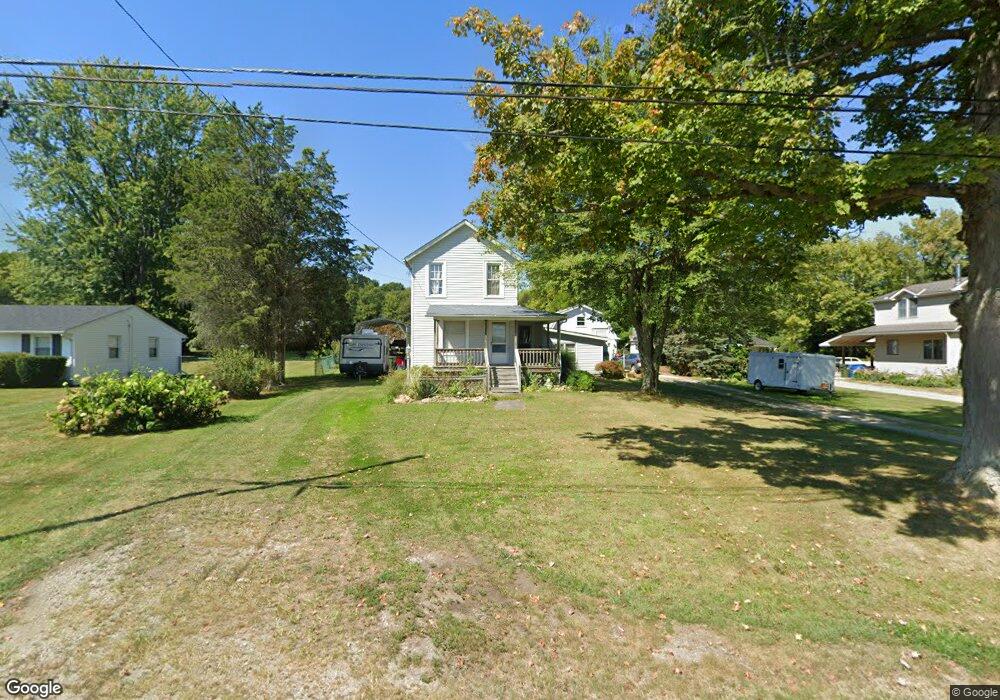
9902 Quarry Rd Amherst, OH 44001
Estimated Value: $208,000 - $251,000
2
Beds
1
Bath
1,374
Sq Ft
$159/Sq Ft
Est. Value
About This Home
This home is located at 9902 Quarry Rd, Amherst, OH 44001 and is currently estimated at $218,936, approximately $159 per square foot. 9902 Quarry Rd is a home located in Lorain County with nearby schools including Firelands Elementary School, Firelands Middle School, and Firelands High School.
Ownership History
Date
Name
Owned For
Owner Type
Purchase Details
Closed on
Jun 22, 2009
Sold by
Secretary Of Housing & Urban Development
Bought by
Scott Amber J
Current Estimated Value
Home Financials for this Owner
Home Financials are based on the most recent Mortgage that was taken out on this home.
Original Mortgage
$78,245
Outstanding Balance
$49,835
Interest Rate
4.92%
Mortgage Type
FHA
Estimated Equity
$169,101
Purchase Details
Closed on
Nov 8, 2007
Sold by
Helton James L and Helton Jennifer L
Bought by
Hud
Purchase Details
Closed on
Sep 23, 2004
Sold by
Helton Jennifer and Casada Melvin
Bought by
Helton James
Purchase Details
Closed on
Oct 8, 1999
Sold by
Carstensen Richard E and Jean Emma
Bought by
Casada Melvin and Helton Jennifer F
Home Financials for this Owner
Home Financials are based on the most recent Mortgage that was taken out on this home.
Original Mortgage
$113,960
Interest Rate
7.87%
Mortgage Type
FHA
Create a Home Valuation Report for This Property
The Home Valuation Report is an in-depth analysis detailing your home's value as well as a comparison with similar homes in the area
Home Values in the Area
Average Home Value in this Area
Purchase History
| Date | Buyer | Sale Price | Title Company |
|---|---|---|---|
| Scott Amber J | $49,000 | Lakeside Title & Escrow Agen | |
| Hud | $80,000 | None Available | |
| Helton James | -- | Truetitle Agency Inc | |
| Casada Melvin | $114,900 | Midland Title |
Source: Public Records
Mortgage History
| Date | Status | Borrower | Loan Amount |
|---|---|---|---|
| Open | Scott Amber J | $78,245 | |
| Previous Owner | Casada Melvin | $113,960 |
Source: Public Records
Tax History Compared to Growth
Tax History
| Year | Tax Paid | Tax Assessment Tax Assessment Total Assessment is a certain percentage of the fair market value that is determined by local assessors to be the total taxable value of land and additions on the property. | Land | Improvement |
|---|---|---|---|---|
| 2024 | $2,322 | $55,720 | $10,854 | $44,867 |
| 2023 | $2,224 | $47,611 | $10,518 | $37,093 |
| 2022 | $2,143 | $47,611 | $10,518 | $37,093 |
| 2021 | $2,141 | $47,611 | $10,518 | $37,093 |
| 2020 | $1,933 | $40,940 | $9,040 | $31,900 |
| 2019 | $1,918 | $40,940 | $9,040 | $31,900 |
| 2018 | $1,890 | $40,940 | $9,040 | $31,900 |
| 2017 | $1,812 | $38,970 | $8,680 | $30,290 |
| 2016 | $1,836 | $38,970 | $8,680 | $30,290 |
| 2015 | $1,838 | $38,970 | $8,680 | $30,290 |
| 2014 | $1,863 | $38,970 | $8,680 | $30,290 |
| 2013 | $1,866 | $38,970 | $8,680 | $30,290 |
Source: Public Records
Map
Nearby Homes
- 48375 Telegraph Rd
- 401 Leonard St
- 314 Fern St
- 402 Church St
- 671 S Lake St
- 6429 Russia Rd
- 5906 Russia Rd
- 198 Oakdale Dr
- 11135 Baumhart Rd
- 9839 Gifford Rd
- Lot B Gifford Rd
- 48221 Rice Rd
- 8030 Pyle South Amherst Rd
- 658 Nicole Dr
- 335 Copper Creek
- 7720 Rice Rd
- 311 Oak St Unit 311
- 814 Valley Dr
- 133 Ambleside Way
- 281 English Lakes Blvd Unit 67281
- 9888 Quarry Rd
- 9932 Quarry Rd
- 9936 Quarry Rd
- 9889 Quarry Rd
- 9950 Quarry Rd
- 9868 Quarry Rd
- 9802 Quarry Rd
- 9999 Quarry Rd
- 9988 Quarry Rd
- 9784 Quarry Rd
- 10025 Quarry Rd
- 10014 Quarry Rd
- 9744 Quarry Rd
- 9706 Quarry Rd
- 10001 Quarry Rd
- 10079 Quarry Rd
- 9701 Quarry Rd
- 10096 Quarry Rd
- 10035 Quarry Rd
- 9660 Quarry Rd