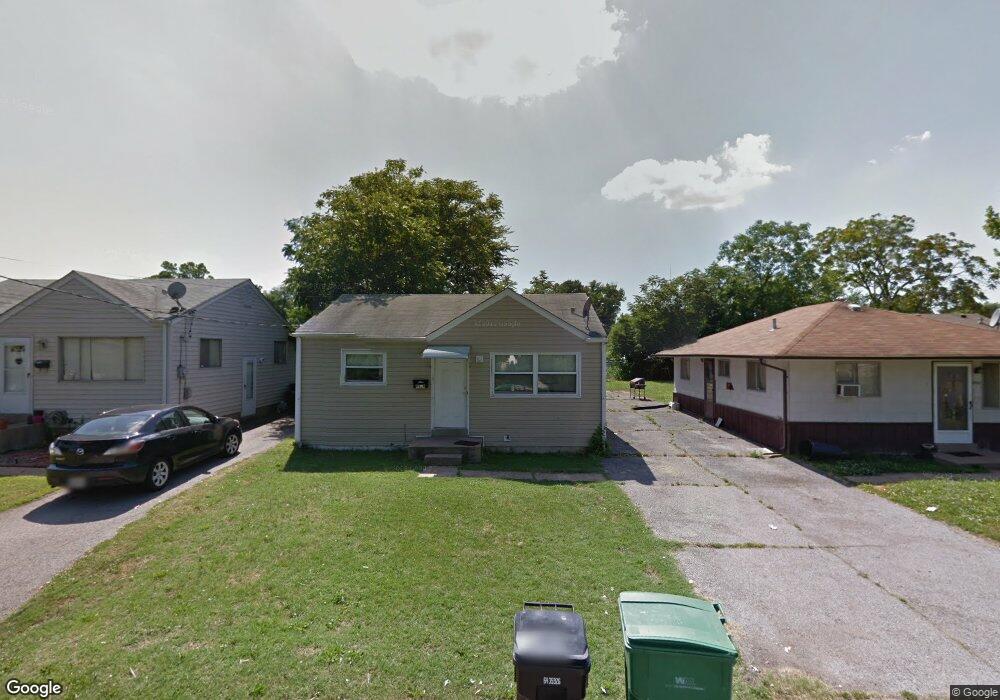
9909 Erie Dr Saint Louis, MO 63125
Lemay NeighborhoodEstimated Value: $63,276 - $117,000
2
Beds
1
Bath
728
Sq Ft
$130/Sq Ft
Est. Value
About This Home
This home is located at 9909 Erie Dr, Saint Louis, MO 63125 and is currently estimated at $94,569, approximately $129 per square foot. 9909 Erie Dr is a home located in St. Louis County with nearby schools including Hancock Place Elementary School, Hancock Place Middle School, and Hancock Place High School.
Ownership History
Date
Name
Owned For
Owner Type
Purchase Details
Closed on
Aug 14, 2014
Sold by
Ruba Dennis
Bought by
Ruba Lisa
Current Estimated Value
Home Financials for this Owner
Home Financials are based on the most recent Mortgage that was taken out on this home.
Original Mortgage
$29,600
Outstanding Balance
$22,637
Interest Rate
4.19%
Mortgage Type
New Conventional
Estimated Equity
$71,932
Purchase Details
Closed on
May 16, 2013
Sold by
Us Bank National Association
Bought by
Ruba Dennis
Purchase Details
Closed on
Jul 27, 2012
Sold by
Doran Realty Company
Bought by
Us Bank National Association
Purchase Details
Closed on
Jun 8, 2007
Sold by
Johnson Christine and Davis Jerry M
Bought by
Doran Realty Co
Purchase Details
Closed on
Jul 30, 1999
Sold by
Patterson John R and Patterson Kim
Bought by
Johnson Christine
Home Financials for this Owner
Home Financials are based on the most recent Mortgage that was taken out on this home.
Original Mortgage
$39,500
Interest Rate
8.5%
Create a Home Valuation Report for This Property
The Home Valuation Report is an in-depth analysis detailing your home's value as well as a comparison with similar homes in the area
Home Values in the Area
Average Home Value in this Area
Purchase History
| Date | Buyer | Sale Price | Title Company |
|---|---|---|---|
| Ruba Lisa | $37,000 | Insight Title | |
| Ruba Dennis | -- | None Available | |
| Us Bank National Association | $21,250 | None Available | |
| Doran Realty Co | $10,000 | None Available | |
| Johnson Christine | $46,000 | -- |
Source: Public Records
Mortgage History
| Date | Status | Borrower | Loan Amount |
|---|---|---|---|
| Open | Ruba Lisa | $29,600 | |
| Previous Owner | Johnson Christine | $39,500 |
Source: Public Records
Tax History Compared to Growth
Tax History
| Year | Tax Paid | Tax Assessment Tax Assessment Total Assessment is a certain percentage of the fair market value that is determined by local assessors to be the total taxable value of land and additions on the property. | Land | Improvement |
|---|---|---|---|---|
| 2025 | $752 | $18,490 | $8,720 | $9,770 |
| 2024 | $752 | $9,470 | $4,470 | $5,000 |
| 2023 | $716 | $9,470 | $4,470 | $5,000 |
| 2022 | $786 | $9,470 | $5,040 | $4,430 |
| 2021 | $773 | $14,650 | $5,040 | $9,610 |
| 2020 | $808 | $9,470 | $5,000 | $4,470 |
| 2019 | $806 | $9,470 | $5,000 | $4,470 |
| 2018 | $1,208 | $12,540 | $4,430 | $8,110 |
| 2017 | $1,188 | $12,540 | $4,430 | $8,110 |
| 2016 | $1,018 | $10,320 | $1,960 | $8,360 |
| 2015 | $1,022 | $10,320 | $1,960 | $8,360 |
| 2014 | $924 | $9,900 | $2,890 | $7,010 |
Source: Public Records
Map
Nearby Homes
- 9933 Linn Ave
- 9953 Sadie Ave
- 9954 Luna Ave
- 9704 S Broadway
- 9950 Meadow Ave
- 135 E Loretta Ave
- 135 E Holden Ave
- 156 W Holden Ave
- 408 W Ripa Ave
- 125 E Etta Ave
- 119 E Cartwright Ave
- 112 Mann St
- 9604 Gentry Ave
- 115 W Cartwright Ave
- 9723 Gentry Ave
- 333 Pentonville Dr
- 311 Degenhardt Ave
- 331 Rauhut Ave
- 333 Rauhut Ave
- 320 Degenhardt Ave
- 9907 Erie Dr
- 9911 Erie Dr
- 9913 Erie Dr
- 9915 Erie Dr
- 110 E Ripa Ave
- 106 E Ripa - To Be Built
- 106 E Ripa Ave
- 112 E Ripa Ave
- 9912 S Broadway
- 9916 S Broadway
- 118 E Ripa Ave
- 9920 S Broadway
- 9910 Erie Dr
- 9900 S Broadway
- 120 E Ripa Ave
- 9918 Erie Dr
- 122 E Ripa Ave
- 124 E Ripa Ave
- 117 E Ripa Ave
- 113 E Ripa Ave