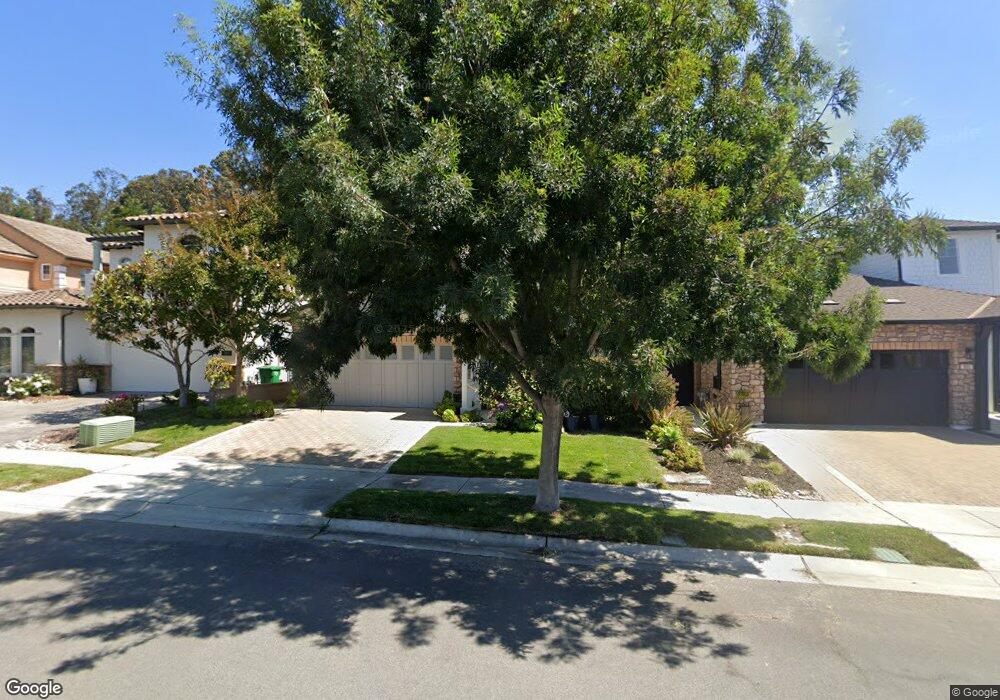
991 Jacqueline Place Nipomo, CA 93444
Woodlands NeighborhoodEstimated Value: $993,159 - $1,165,000
3
Beds
3
Baths
1,933
Sq Ft
$568/Sq Ft
Est. Value
About This Home
This home is located at 991 Jacqueline Place, Nipomo, CA 93444 and is currently estimated at $1,098,790, approximately $568 per square foot. 991 Jacqueline Place is a home located in San Luis Obispo County with nearby schools including Dorothea Lange Elementary School, Mesa Middle School, and Nipomo High School.
Ownership History
Date
Name
Owned For
Owner Type
Purchase Details
Closed on
Jul 18, 2011
Sold by
Atkins Claudia Loraine
Bought by
Beene Gary L and Beene Yvonne S
Current Estimated Value
Home Financials for this Owner
Home Financials are based on the most recent Mortgage that was taken out on this home.
Original Mortgage
$332,000
Outstanding Balance
$24,928
Interest Rate
4.53%
Mortgage Type
New Conventional
Estimated Equity
$1,073,862
Purchase Details
Closed on
Apr 9, 2008
Sold by
Shea Homes Lp
Bought by
Bowen Claudia Loraine and Bowen Thomas Howard
Home Financials for this Owner
Home Financials are based on the most recent Mortgage that was taken out on this home.
Original Mortgage
$325,000
Interest Rate
5.99%
Mortgage Type
Purchase Money Mortgage
Create a Home Valuation Report for This Property
The Home Valuation Report is an in-depth analysis detailing your home's value as well as a comparison with similar homes in the area
Home Values in the Area
Average Home Value in this Area
Purchase History
| Date | Buyer | Sale Price | Title Company |
|---|---|---|---|
| Beene Gary L | $415,000 | Fidelity National Title Co | |
| Bowen Claudia Loraine | $525,000 | First American Title Co |
Source: Public Records
Mortgage History
| Date | Status | Borrower | Loan Amount |
|---|---|---|---|
| Open | Beene Gary L | $332,000 | |
| Previous Owner | Bowen Claudia Loraine | $325,000 |
Source: Public Records
Tax History Compared to Growth
Tax History
| Year | Tax Paid | Tax Assessment Tax Assessment Total Assessment is a certain percentage of the fair market value that is determined by local assessors to be the total taxable value of land and additions on the property. | Land | Improvement |
|---|---|---|---|---|
| 2025 | $5,361 | $521,252 | $251,206 | $270,046 |
| 2024 | $5,300 | $511,032 | $246,281 | $264,751 |
| 2023 | $5,300 | $501,012 | $241,452 | $259,560 |
| 2022 | $5,220 | $491,189 | $236,718 | $254,471 |
| 2021 | $5,211 | $481,559 | $232,077 | $249,482 |
| 2020 | $5,151 | $476,622 | $229,698 | $246,924 |
| 2019 | $5,119 | $467,278 | $225,195 | $242,083 |
| 2018 | $5,058 | $458,117 | $220,780 | $237,337 |
| 2017 | $4,964 | $449,135 | $216,451 | $232,684 |
| 2016 | $4,682 | $440,329 | $212,207 | $228,122 |
| 2015 | $4,614 | $433,716 | $209,020 | $224,696 |
| 2014 | $4,443 | $425,221 | $204,926 | $220,295 |
Source: Public Records
Map
Nearby Homes
- 977 Jacqueline Place
- 961 Jacqueline Place
- 1539 Vista Tesoro Place
- 1685 Louise Ln
- 1147 Vaquero Way
- 1441 Vicki Ln
- 1783 Trilogy Pkwy
- 1153 Spring Azure Way
- 1156 Spring Azure Way
- 1160 Korey Ct
- 1187 Swallowtail Way
- 1849 Eucalyptus Rd
- 1175 Danielle Ct
- 1084 Emma Ln
- 1354 Trail View Place
- 1024 Maggie Ln
- 1455 Via Vista
- 1441 Via Vista
- 867 Trail View Place
- 1195 Trail View Place
- 995 Jacqueline Place
- 989 Jacqueline Place
- 985 Jacqueline Place
- 1603 Payton Way
- 981 Jacqueline Place
- 1003 Jacqueline Place
- 1605 Payton Way
- 1005 Jacqueline Place
- 1002 Jacqueline Place
- 1602 Payton Way
- 973 Jacqueline Place
- 1007 Jacqueline Place
- 1607 Payton Way
- 1004 Jacqueline Place
- 1604 Payton Way
- 1006 Jacqueline Place
- 969 Jacqueline Place
- 1609 Payton Way