Estimated Value: $293,000 - $1,510,000
3
Beds
2
Baths
1,921
Sq Ft
$574/Sq Ft
Est. Value
About This Home
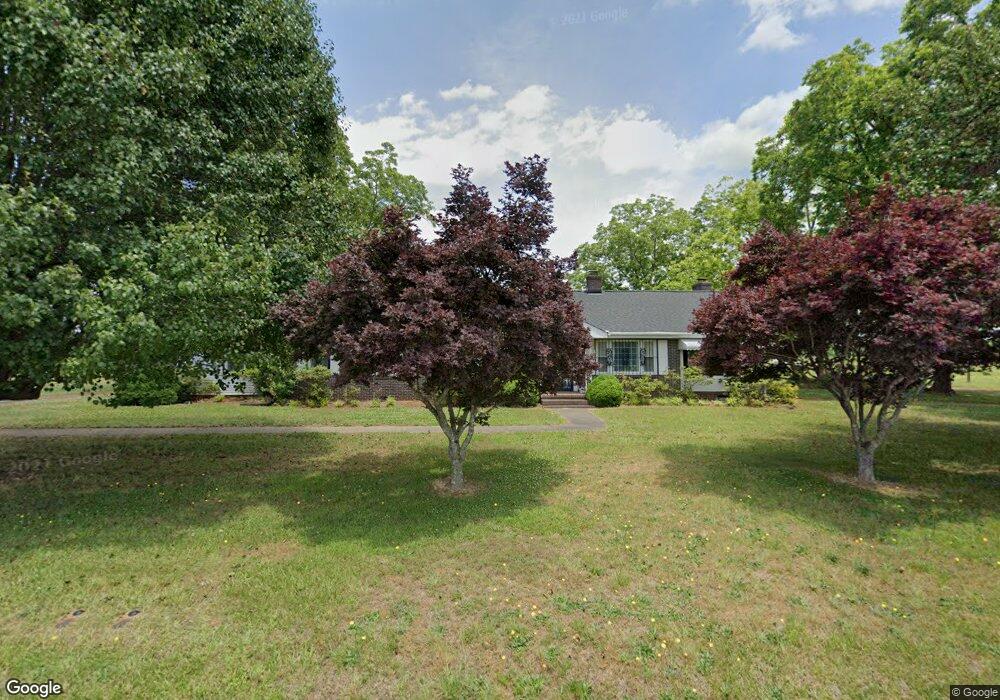
This home is located at 991 Robinson Rd, Greer, SC 29651 and is currently estimated at $1,102,564, approximately $573 per square foot. 991 Robinson Rd is a home located in Spartanburg County with nearby schools including Duncan Elementary School, Byrnes Freshman Academy, and Beech Springs Intermediate School.
Ownership History
Date
Name
Owned For
Owner Type
Purchase Details
Closed on
Dec 6, 2021
Sold by
Dawson Janet G
Bought by
Crusoe Acquisitions Llc and Jupiter Two Properties Llc
Current Estimated Value
Home Financials for this Owner
Home Financials are based on the most recent Mortgage that was taken out on this home.
Original Mortgage
$850,000
Outstanding Balance
$716,530
Interest Rate
3.11%
Mortgage Type
Commercial
Estimated Equity
$386,034
Purchase Details
Closed on
Oct 20, 2015
Sold by
Dawson Janet G
Bought by
Cullum Gsp 081 Lp
Home Financials for this Owner
Home Financials are based on the most recent Mortgage that was taken out on this home.
Original Mortgage
$1,446,250
Interest Rate
3.94%
Mortgage Type
New Conventional
Purchase Details
Closed on
Apr 14, 2003
Sold by
Dawson Janet G
Bought by
Genoble Leonard G
Create a Home Valuation Report for This Property
The Home Valuation Report is an in-depth analysis detailing your home's value as well as a comparison with similar homes in the area
Home Values in the Area
Average Home Value in this Area
Purchase History
| Date | Buyer | Sale Price | Title Company |
|---|---|---|---|
| Crusoe Acquisitions Llc | $1,250,000 | None Available | |
| Cullum Gsp 081 Lp | $941,346 | -- | |
| Genoble Leonard G | -- | -- | |
| Dawson Janet G | -- | -- | |
| Dawson Janet G | -- | -- |
Source: Public Records
Mortgage History
| Date | Status | Borrower | Loan Amount |
|---|---|---|---|
| Open | Crusoe Acquisitions Llc | $850,000 | |
| Previous Owner | Cullum Gsp 081 Lp | $1,446,250 |
Source: Public Records
Tax History
| Year | Tax Paid | Tax Assessment Tax Assessment Total Assessment is a certain percentage of the fair market value that is determined by local assessors to be the total taxable value of land and additions on the property. | Land | Improvement |
|---|---|---|---|---|
| 2025 | $80 | -- | -- | -- |
| 2024 | $80 | -- | -- | -- |
| 2023 | $80 | $86,250 | $78,134 | $8,116 |
Source: Public Records
Map
Nearby Homes
- 687 Robinson Rd
- 0 Robinson Rd Unit 318992
- 205 Genoble Rd
- 1985 Gilliam Rd
- 110 Holly Creek Dr
- 123 Sunny Ray Dr
- 198 Spring St
- 101 Gap Creek Rd
- 92 North St
- 116 Johnson St
- 201 Old Jones Rd
- 108 Piedmont St
- 0 S Danzler Rd Unit 7362340
- 101 Parker St
- 124 Lyman Ave
- 128 Lyman Ave
- 296 Forest Lake Rd
- 0 Leonard Rd Unit 2518500
- 0 Leonard Rd Unit 1564811
- 114 N Moore St
- 980 Robinson Rd
- 506/508 Robinson Rd
- 110 Fulmer Dr
- 114 Fulmer Dr
- 102 Fulmer Dr
- 1010 Robinson Rd
- 1101 Woods Chapel Rd
- 887 Robinson Rd
- 1050 Woods Chapel Rd
- 884 Robinson Rd
- 1040 Woods Chapel Rd
- 1004 Woods Chapel Rd
- 1020 Woods Chapel Rd
- 998 Woods Chapel Rd
- 1003 Woods Chapel Rd
- 285 Twin Valley Rd
- 990 Woods Chapel Rd
- 935 Woods Chapel Rd
- 935 Woods Chapel Rd Unit 915 Woods Chapel Rd
- 935 Woods Chapel Rd
Your Personal Tour Guide
Ask me questions while you tour the home.