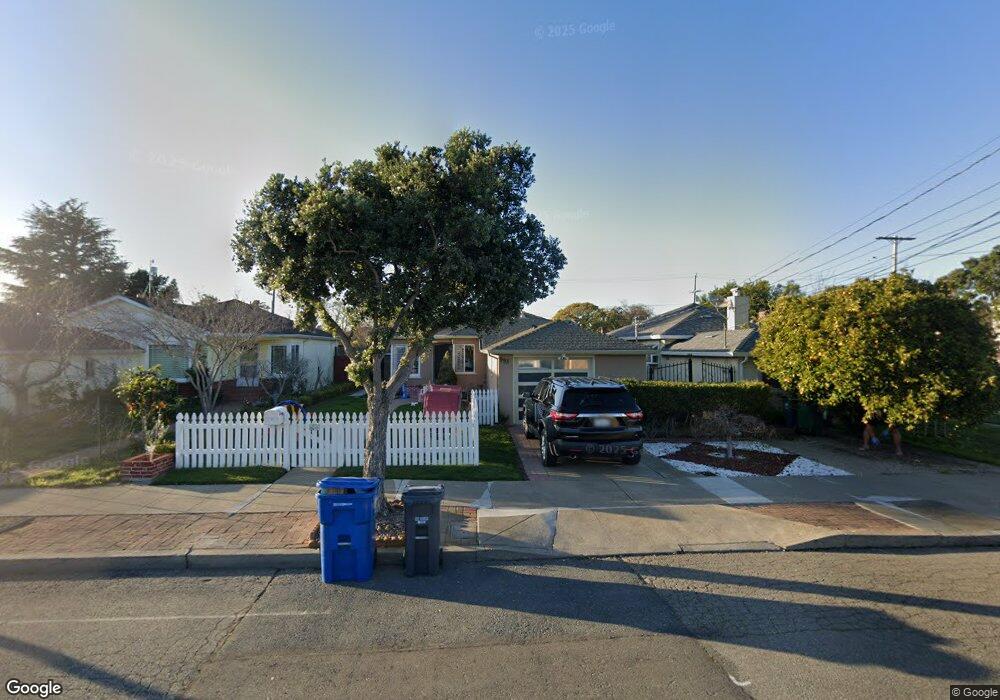
993 Post St Alameda, CA 94501
South Shore NeighborhoodEstimated Value: $869,581 - $1,150,000
3
Beds
1
Bath
995
Sq Ft
$1,006/Sq Ft
Est. Value
About This Home
This home is located at 993 Post St, Alameda, CA 94501 and is currently estimated at $1,001,145, approximately $1,006 per square foot. 993 Post St is a home located in Alameda County with nearby schools including Frank Otis Elementary School, Lincoln Middle School, and Alameda High School.
Ownership History
Date
Name
Owned For
Owner Type
Purchase Details
Closed on
Nov 13, 2017
Sold by
Nelson Janice Elaine
Bought by
Nelson Gary B and Nelson Janice E
Current Estimated Value
Purchase Details
Closed on
Mar 7, 2013
Sold by
Coffman Ronald Floyd and Nelson Janice Elaine
Bought by
Coffman Marcus H and The Marcus H Coffman Trust
Purchase Details
Closed on
May 13, 1998
Sold by
Coffman Marcus H
Bought by
Coffman Ronald Floyd and Nelson Janice Elaine
Create a Home Valuation Report for This Property
The Home Valuation Report is an in-depth analysis detailing your home's value as well as a comparison with similar homes in the area
Home Values in the Area
Average Home Value in this Area
Purchase History
| Date | Buyer | Sale Price | Title Company |
|---|---|---|---|
| Nelson Gary B | -- | None Available | |
| Nelson Janice Elaine | -- | None Available | |
| Coffman Marcus H | -- | None Available | |
| Coffman Ronald Floyd | -- | -- |
Source: Public Records
Tax History
| Year | Tax Paid | Tax Assessment Tax Assessment Total Assessment is a certain percentage of the fair market value that is determined by local assessors to be the total taxable value of land and additions on the property. | Land | Improvement |
|---|---|---|---|---|
| 2025 | $2,904 | $86,793 | $52,468 | $34,325 |
| 2024 | $2,904 | $85,091 | $51,439 | $33,652 |
| 2023 | $2,825 | $83,423 | $50,431 | $32,992 |
| 2022 | $2,769 | $81,787 | $49,442 | $32,345 |
| 2021 | $2,720 | $80,183 | $48,472 | $31,711 |
| 2020 | $2,688 | $79,362 | $47,976 | $31,386 |
| 2019 | $2,327 | $77,805 | $47,035 | $30,770 |
| 2018 | $2,279 | $76,280 | $46,113 | $30,167 |
| 2017 | $2,215 | $74,785 | $45,209 | $29,576 |
| 2016 | $2,190 | $73,318 | $44,322 | $28,996 |
| 2015 | $2,173 | $72,217 | $43,657 | $28,560 |
| 2014 | $2,068 | $70,802 | $42,801 | $28,001 |
Source: Public Records
Map
Nearby Homes
- 3248 Briggs Ave
- 405 Centre Ct
- 608 Centre Ct
- 641 Centre Ct
- 1324 Grove St
- 632 Centre Ct Unit 48
- 2959 Sea View Pkwy
- 3235 Central Ave
- 137 Parfait Ln
- 1321 Pearl St
- 1376 Versailles Ave
- 2857 Sea View Pkwy
- 3246 Garfield Ave
- 30 Sea Bridge
- 2608 Central Ave
- 954 Park St
- 976 Park St
- 2417 Marti Rae Ct
- 3226 Fairview Ave
- 2312 San Antonio Ave
Your Personal Tour Guide
Ask me questions while you tour the home.