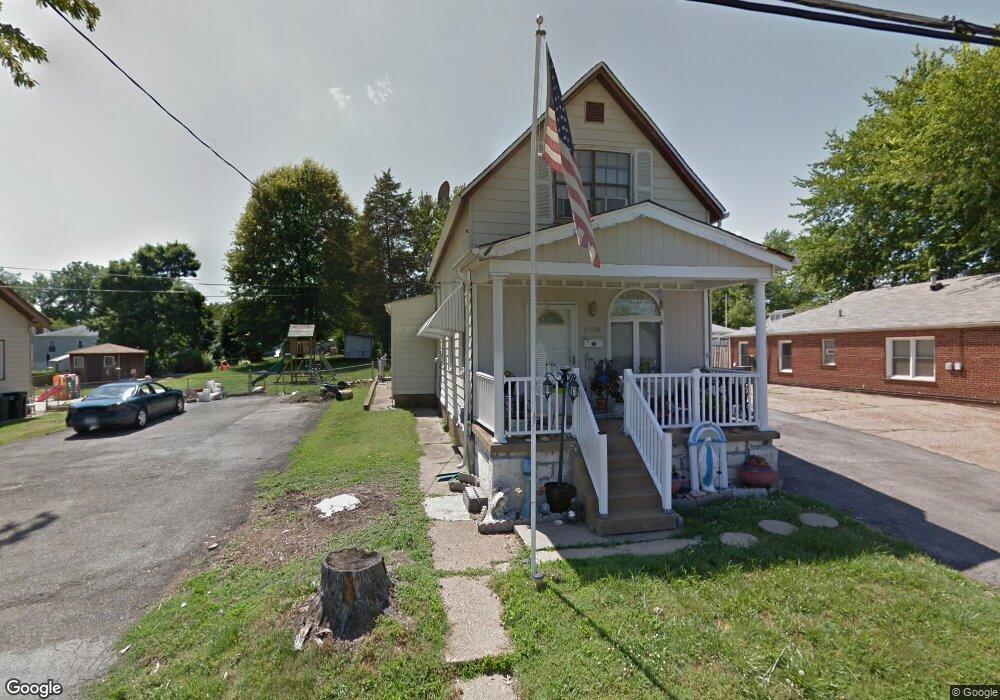
9949 Luna Ave Saint Louis, MO 63125
Lemay NeighborhoodEstimated Value: $124,000 - $130,000
2
Beds
1
Bath
1,042
Sq Ft
$121/Sq Ft
Est. Value
About This Home
This home is located at 9949 Luna Ave, Saint Louis, MO 63125 and is currently estimated at $126,343, approximately $121 per square foot. 9949 Luna Ave is a home located in St. Louis County with nearby schools including Hancock Place Elementary School, Hancock Place Middle School, and Hancock Place High School.
Ownership History
Date
Name
Owned For
Owner Type
Purchase Details
Closed on
Jul 31, 2021
Sold by
Level Mary and Level David M
Bought by
Level Mary
Current Estimated Value
Home Financials for this Owner
Home Financials are based on the most recent Mortgage that was taken out on this home.
Original Mortgage
$59,000
Outstanding Balance
$53,500
Interest Rate
3%
Mortgage Type
New Conventional
Estimated Equity
$72,843
Purchase Details
Closed on
Apr 2, 2020
Sold by
Williams Daisy
Bought by
Williams Daisy and Level Mary
Purchase Details
Closed on
Dec 21, 2017
Sold by
Williams Daisy
Bought by
Williams Daisy and Level Mary
Purchase Details
Closed on
Feb 29, 2008
Sold by
Ruma Helen M
Bought by
Wm Specialty Mortgage Llc
Purchase Details
Closed on
Dec 2, 1999
Sold by
Bussone Ginger S and Bussone Robert A
Bought by
Ruma Helen M
Home Financials for this Owner
Home Financials are based on the most recent Mortgage that was taken out on this home.
Original Mortgage
$45,600
Interest Rate
11.12%
Create a Home Valuation Report for This Property
The Home Valuation Report is an in-depth analysis detailing your home's value as well as a comparison with similar homes in the area
Home Values in the Area
Average Home Value in this Area
Purchase History
| Date | Buyer | Sale Price | Title Company |
|---|---|---|---|
| Level Mary | -- | Title Resources Inc | |
| Williams Daisy | -- | None Listed On Document | |
| Williams Daisy | -- | None Available | |
| Wm Specialty Mortgage Llc | $69,660 | None Available | |
| Ruma Helen M | $57,000 | -- |
Source: Public Records
Mortgage History
| Date | Status | Borrower | Loan Amount |
|---|---|---|---|
| Open | Level Mary | $59,000 | |
| Previous Owner | Ruma Helen M | $45,600 |
Source: Public Records
Tax History Compared to Growth
Tax History
| Year | Tax Paid | Tax Assessment Tax Assessment Total Assessment is a certain percentage of the fair market value that is determined by local assessors to be the total taxable value of land and additions on the property. | Land | Improvement |
|---|---|---|---|---|
| 2025 | $1,481 | $19,340 | $7,450 | $11,890 |
| 2024 | $1,481 | $18,990 | $5,590 | $13,400 |
| 2023 | $1,481 | $18,990 | $5,590 | $13,400 |
| 2022 | $1,179 | $14,370 | $4,850 | $9,520 |
| 2021 | $1,159 | $14,370 | $4,850 | $9,520 |
| 2020 | $1,098 | $13,000 | $5,590 | $7,410 |
| 2019 | $1,095 | $13,000 | $5,590 | $7,410 |
| 2018 | $816 | $8,370 | $4,280 | $4,090 |
| 2017 | $802 | $8,370 | $4,280 | $4,090 |
| 2016 | $832 | $8,380 | $2,980 | $5,400 |
| 2015 | $835 | $8,380 | $2,980 | $5,400 |
| 2014 | $894 | $9,560 | $3,400 | $6,160 |
Source: Public Records
Map
Nearby Homes
- 9954 Luna Ave
- 9953 Sadie Ave
- 9950 Meadow Ave
- 408 W Ripa Ave
- 149 W Felton Ave
- 9933 Linn Ave
- 9704 S Broadway
- 156 W Holden Ave
- 135 E Loretta Ave
- 333 Pentonville Dr
- 135 E Holden Ave
- 9723 Gentry Ave
- 2105 Telford Dr
- 9604 Gentry Ave
- 2228 Hagenstone Terrace
- 1656 Herault Place
- 1408 Dammert Ave
- 125 E Etta Ave
- 1677 Herault Place Unit B
- 1673 Herault Place Unit B
- 9945 Luna Ave
- 9917 Luna Ave
- 210 W Ripa Ave
- 200 W Ripa Ave
- 212 W Ripa Ave
- 9916 Clyde Ave
- 140 W Ripa Ave
- 9950 Luna Ave
- 9948 Luna Ave
- 128 W Ripa Ave
- 9952 Luna Ave
- 9951 Luna Ave Unit 12
- 9951 Luna Ave
- 9920 Clyde Ave
- 214 W Ripa Ave
- 126 W Ripa Ave
- 9924 Clyde Ave
- 9953 Luna Ave Unit 12
- 9953 Luna Ave
- 9953 Luna 1 2 Ave