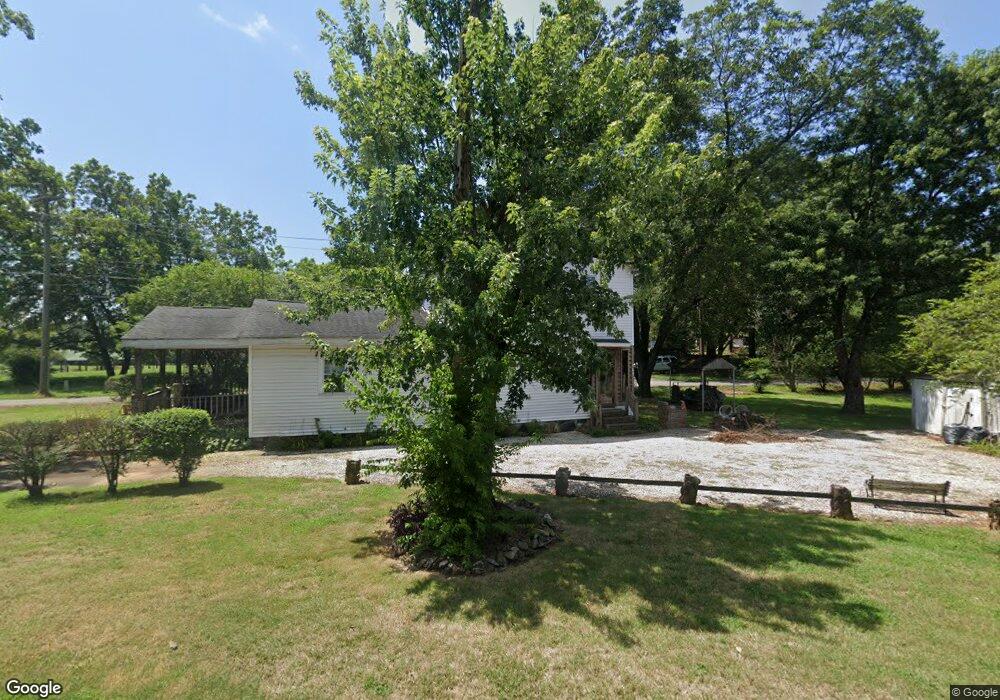
995 Cothran Cir Anderson, SC 29625
Estimated Value: $119,496 - $316,000
Studio
--
Bath
1,167
Sq Ft
$202/Sq Ft
Est. Value
About This Home
This home is located at 995 Cothran Cir, Anderson, SC 29625 and is currently estimated at $235,374, approximately $201 per square foot. 995 Cothran Cir is a home with nearby schools including Pendleton High School.
Ownership History
Date
Name
Owned For
Owner Type
Purchase Details
Closed on
Aug 27, 2021
Sold by
Singh Mangal and Padda Mangel Singh
Bought by
Padda 1 Llc
Current Estimated Value
Purchase Details
Closed on
Jul 13, 2020
Sold by
Moore William C and Branyon Steven G
Bought by
Delaney William F and Delaney Cheryl A
Purchase Details
Closed on
Nov 26, 2019
Sold by
Moore William C and Branyon Steven G
Bought by
Brock Evans
Purchase Details
Closed on
Dec 13, 2018
Sold by
Moore William C and Branyon Steven G
Bought by
Jones Daniel and Jones Cheronda
Home Financials for this Owner
Home Financials are based on the most recent Mortgage that was taken out on this home.
Original Mortgage
$427,500
Interest Rate
4.9%
Mortgage Type
Construction
Purchase Details
Closed on
Aug 28, 2014
Sold by
Pruitt Davi A
Bought by
Horton Bryan D and Horton Cherith
Purchase Details
Closed on
Jun 25, 2003
Sold by
Pruitt David A
Bought by
Padda Mangal S
Create a Home Valuation Report for This Property
The Home Valuation Report is an in-depth analysis detailing your home's value as well as a comparison with similar homes in the area
Home Values in the Area
Average Home Value in this Area
Purchase History
| Date | Buyer | Sale Price | Title Company |
|---|---|---|---|
| Padda 1 Llc | -- | None Listed On Document | |
| Delaney William F | $57,771 | None Available | |
| Brock Evans | $67,500 | None Available | |
| Hardin Dorothy | $65,000 | None Available | |
| Jones Daniel | $97,520 | None Available | |
| Horton Bryan D | $2,000 | -- | |
| Padda Mangal S | $30,000 | -- |
Source: Public Records
Mortgage History
| Date | Status | Borrower | Loan Amount |
|---|---|---|---|
| Previous Owner | Jones Daniel | $427,500 |
Source: Public Records
Tax History
| Year | Tax Paid | Tax Assessment Tax Assessment Total Assessment is a certain percentage of the fair market value that is determined by local assessors to be the total taxable value of land and additions on the property. | Land | Improvement |
|---|---|---|---|---|
| 2024 | $1,220 | $3,820 | $1,000 | $2,820 |
| 2023 | $1,213 | $3,820 | $1,000 | $2,820 |
| 2022 | $1,129 | $3,820 | $1,000 | $2,820 |
| 2021 | $1,069 | $3,230 | $640 | $2,590 |
| 2020 | $1,060 | $3,230 | $640 | $2,590 |
| 2019 | $1,060 | $3,230 | $640 | $2,590 |
| 2018 | $1,046 | $3,230 | $640 | $2,590 |
| 2017 | -- | $3,230 | $640 | $2,590 |
| 2016 | $897 | $3,240 | $480 | $2,760 |
| 2015 | $898 | $3,240 | $480 | $2,760 |
| 2014 | $895 | $3,240 | $480 | $2,760 |
Source: Public Records
Map
Nearby Homes
- 133 Hurst Ave
- 126 Mays St
- 325 Circle Dr
- 116 Veranda Cir
- 220 Owens Cir
- 00 La France Rd
- 1304 Old Denver School Rd
- 1308 Old Denver School Rd
- 115 Creekwalk Dr
- 113 Wild Oak Run
- 00 Lafrance Rd
- Lot 3 Hwy 76 Hwy
- Gibson Rd
- 441 Spring Rd
- 1305 Summers Dr
- 01 Gibson Rd
- 02 Gibson Rd
- 03 Gibson Rd
- 04 Gibson Rd
- 112 Donald Dr
- 1431 Sandy Springs Rd
- 964 Boscobel Rd
- 1001 Cothran Cir
- 958 Boscobel Rd
- 1405 Sandy Springs Rd
- 1003 Cothran Cir
- 1403 Sandy Springs Rd
- 1017 Cothran Cir
- 1006 Cothran Cir
- 1101 Watkins Rd
- 1005 Cothran Cir
- 1015 Cothran Cir
- 1024 Cothran Cir
- 1009 Cothran Cir
- 1105 Watkins Rd
- 1018 Cothran Cir
- 104 Cutliff Ln
- 1107 Watkins Rd
- 144 Hurst Ave
- 146 Hurst Ave
Your Personal Tour Guide
Ask me questions while you tour the home.