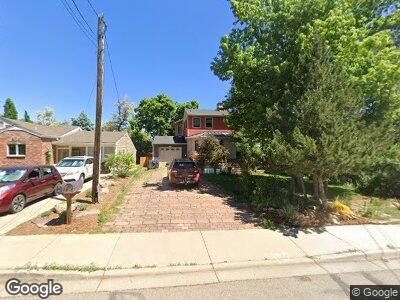
995 Utica Ave Boulder, CO 80304
Wonderland NeighborhoodEstimated Value: $1,459,000 - $2,067,000
3
Beds
2
Baths
2,064
Sq Ft
$813/Sq Ft
Est. Value
About This Home
This home is located at 995 Utica Ave, Boulder, CO 80304 and is currently estimated at $1,677,354, approximately $812 per square foot. 995 Utica Ave is a home located in Boulder County with nearby schools including Foothill Elementary School, Centennial Middle School, and Boulder High School.
Ownership History
Date
Name
Owned For
Owner Type
Purchase Details
Closed on
Oct 5, 2009
Sold by
Paranka Nancy Shipp and Paranka David
Bought by
Friedman Gregg
Current Estimated Value
Home Financials for this Owner
Home Financials are based on the most recent Mortgage that was taken out on this home.
Original Mortgage
$233,500
Interest Rate
4.83%
Mortgage Type
New Conventional
Purchase Details
Closed on
Oct 12, 2001
Sold by
Kiefel Ronald A
Bought by
Paranka David and Paranka Nancy Shipp
Home Financials for this Owner
Home Financials are based on the most recent Mortgage that was taken out on this home.
Original Mortgage
$21,600
Interest Rate
6.84%
Mortgage Type
Stand Alone Second
Purchase Details
Closed on
Feb 14, 1992
Bought by
Friedman Gregg and Friedman Nancy Fishbein
Purchase Details
Closed on
Oct 16, 1985
Bought by
Friedman Gregg and Friedman Nancy Fishbein
Purchase Details
Closed on
Mar 26, 1984
Bought by
Friedman Gregg and Friedman Nancy Fishbein
Create a Home Valuation Report for This Property
The Home Valuation Report is an in-depth analysis detailing your home's value as well as a comparison with similar homes in the area
Home Values in the Area
Average Home Value in this Area
Purchase History
| Date | Buyer | Sale Price | Title Company |
|---|---|---|---|
| Friedman Gregg | $533,500 | Guardian Title | |
| Paranka David | $373,350 | -- | |
| Friedman Gregg | -- | -- | |
| Friedman Gregg | $102,500 | -- | |
| Friedman Gregg | $25,000 | -- |
Source: Public Records
Mortgage History
| Date | Status | Borrower | Loan Amount |
|---|---|---|---|
| Closed | Friedman Gregg | $300,000 | |
| Closed | Friedman Gregg | $229,000 | |
| Closed | Firedman Gregg | $230,000 | |
| Closed | Friedman Gregg | $233,500 | |
| Previous Owner | Paranka Nancy Shipp | $320,000 | |
| Previous Owner | Paranka Nancy Shipp | $120,000 | |
| Previous Owner | Paranka David G | $65,000 | |
| Previous Owner | Paranka Nancy Shipp | $333,000 | |
| Previous Owner | Paranka David | $60,000 | |
| Previous Owner | Paranka David | $300,700 | |
| Previous Owner | Paranka David G | $50,000 | |
| Previous Owner | Paranka David | $299,200 | |
| Previous Owner | Paranka David | $21,600 | |
| Previous Owner | Paranka David | $354,683 |
Source: Public Records
Tax History Compared to Growth
Tax History
| Year | Tax Paid | Tax Assessment Tax Assessment Total Assessment is a certain percentage of the fair market value that is determined by local assessors to be the total taxable value of land and additions on the property. | Land | Improvement |
|---|---|---|---|---|
| 2024 | $8,869 | $92,613 | $62,425 | $30,188 |
| 2023 | $8,715 | $100,915 | $68,126 | $36,475 |
| 2022 | $7,208 | $77,624 | $54,578 | $23,046 |
| 2021 | $6,874 | $79,858 | $56,149 | $23,709 |
| 2020 | $6,208 | $71,315 | $40,827 | $30,488 |
| 2019 | $6,113 | $71,315 | $40,827 | $30,488 |
| 2018 | $5,495 | $63,382 | $27,144 | $36,238 |
| 2017 | $5,323 | $70,072 | $30,009 | $40,063 |
| 2016 | $5,438 | $62,820 | $38,765 | $24,055 |
| 2015 | $5,149 | $50,928 | $17,194 | $33,734 |
| 2014 | $4,282 | $50,928 | $17,194 | $33,734 |
Source: Public Records
Map
Nearby Homes
- 913 Utica Ave
- 990 Utica Cir
- 1120 Violet Ave
- 1130 Violet Ave
- 1140 Violet Ave
- 1150 Violet Ave
- 1160 Violet Ave
- 1170 Violet Ave
- 805 Union Ave
- 1135 Redwood Ave
- 4520 Broadway St Unit 208
- 1149 Quince Ave
- 4555 13th St Unit 2-C
- 1555 Sumac Ave
- 4156 15th St
- 1540 Sumac Ave
- 4585 13th St Unit 1
- 1560 Sumac Ave
- 1200 Yarmouth Ave Unit 238
- 1200 Yarmouth Ave Unit 239