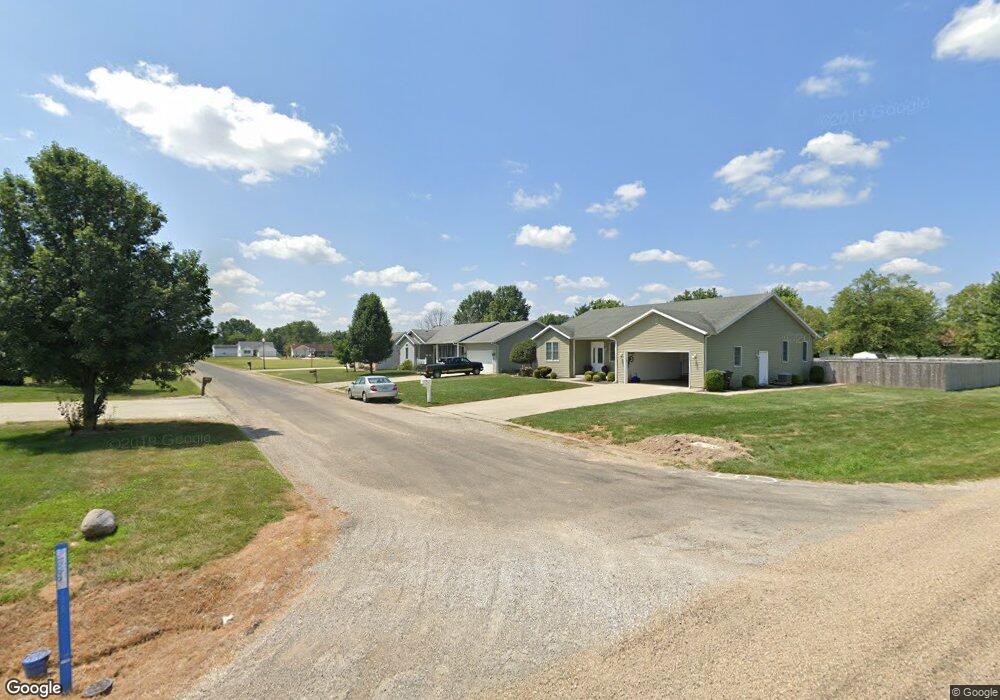
9979 N Country Dr Effingham, IL 62401
Estimated Value: $245,855 - $688,000
3
Beds
3
Baths
1,719
Sq Ft
$218/Sq Ft
Est. Value
About This Home
This home is located at 9979 N Country Dr, Effingham, IL 62401 and is currently estimated at $373,964, approximately $217 per square foot. 9979 N Country Dr is a home located in Effingham County with nearby schools including Central Grade School, Early Learning Center, and South Side Grade School.
Ownership History
Date
Name
Owned For
Owner Type
Purchase Details
Closed on
Sep 25, 2014
Sold by
Shadwell Myrna L and Ferchow Sarah Janette
Bought by
Hoffman Andrew C and Hoffman Lynsie
Current Estimated Value
Home Financials for this Owner
Home Financials are based on the most recent Mortgage that was taken out on this home.
Original Mortgage
$131,000
Outstanding Balance
$101,419
Interest Rate
4.37%
Mortgage Type
New Conventional
Estimated Equity
$272,545
Purchase Details
Closed on
Jul 31, 2008
Sold by
Donaldson Darren and Donaldson Amy
Bought by
Shadwell Delvenia G and Shadwell Myrna L
Home Financials for this Owner
Home Financials are based on the most recent Mortgage that was taken out on this home.
Original Mortgage
$140,800
Interest Rate
5.95%
Mortgage Type
New Conventional
Purchase Details
Closed on
Sep 24, 2007
Sold by
Esker Dale K and Esker Vickie Jo
Bought by
Donaldson Darren and Donaldson Amy
Create a Home Valuation Report for This Property
The Home Valuation Report is an in-depth analysis detailing your home's value as well as a comparison with similar homes in the area
Home Values in the Area
Average Home Value in this Area
Purchase History
| Date | Buyer | Sale Price | Title Company |
|---|---|---|---|
| Hoffman Andrew C | -- | None Available | |
| Shadwell Delvenia G | -- | None Available | |
| Donaldson Darren | $25,000 | None Available |
Source: Public Records
Mortgage History
| Date | Status | Borrower | Loan Amount |
|---|---|---|---|
| Open | Hoffman Andrew C | $131,000 | |
| Previous Owner | Shadwell Delvenia G | $140,800 |
Source: Public Records
Tax History Compared to Growth
Tax History
| Year | Tax Paid | Tax Assessment Tax Assessment Total Assessment is a certain percentage of the fair market value that is determined by local assessors to be the total taxable value of land and additions on the property. | Land | Improvement |
|---|---|---|---|---|
| 2024 | $3,611 | $72,630 | $4,940 | $67,690 |
| 2023 | $3,266 | $65,730 | $4,470 | $61,260 |
| 2022 | $3,021 | $59,750 | $4,060 | $55,690 |
| 2021 | $3,066 | $60,350 | $4,100 | $56,250 |
| 2020 | $2,977 | $58,370 | $3,970 | $54,400 |
| 2019 | $2,882 | $56,670 | $3,850 | $52,820 |
| 2018 | $2,789 | $54,490 | $3,700 | $50,790 |
| 2017 | $3,111 | $59,230 | $3,590 | $55,640 |
| 2016 | $3,025 | $56,950 | $3,450 | $53,500 |
| 2015 | -- | $55,830 | $3,380 | $52,450 |
| 2014 | -- | $54,200 | $3,280 | $50,920 |
| 2013 | -- | $54,200 | $3,280 | $50,920 |
| 2012 | -- | $53,670 | $3,250 | $50,420 |
Source: Public Records
Map
Nearby Homes
- 14326 E Persimmon Ave
- 14163 E Libbie Ln
- 15690 E 1100th Ave
- 3020 Sugar Mill Ct
- 31 Easy Breeze
- 103 E Mount Vernon Ave
- 8434 N Meadowview Rd
- 102 Davis Dr
- 100 Chaparral St
- 103 Oak Dr
- 504 A&B E Hendelmeyer Ave Unit B
- 105 W Kagay Ave
- 103 W Kagay Ave
- 1601 S Park St
- 220 S East St
- 1005 S 3rd St
- 601 E Dogwood Ave
- 812 S 4th St
- 704 S Pembroke St
- 1003 Lynn Dr
- 9969 N Country Dr
- 9995 N Country Dr
- 9972 N Briar Ln
- 9948 N Briar Ln
- 9984 N Country Dr
- 9964 N Country Dr
- 9918 N Briar Ln
- 14090 E Dutch Ln
- 9971 N Briar Ln
- 9924 N Country Dr
- 9945 N Briar Ln
- 14100 E Dutch Ln
- 9917 N Briar Ln
- 9904 N Country Dr
- 0 Southtown Dr
- 9859 Southtown Dr
- 9865 Southtown Dr
- 14091 N Southtown Dr
- 14103 N Southtown Dr
- 9891 N Briar Ln