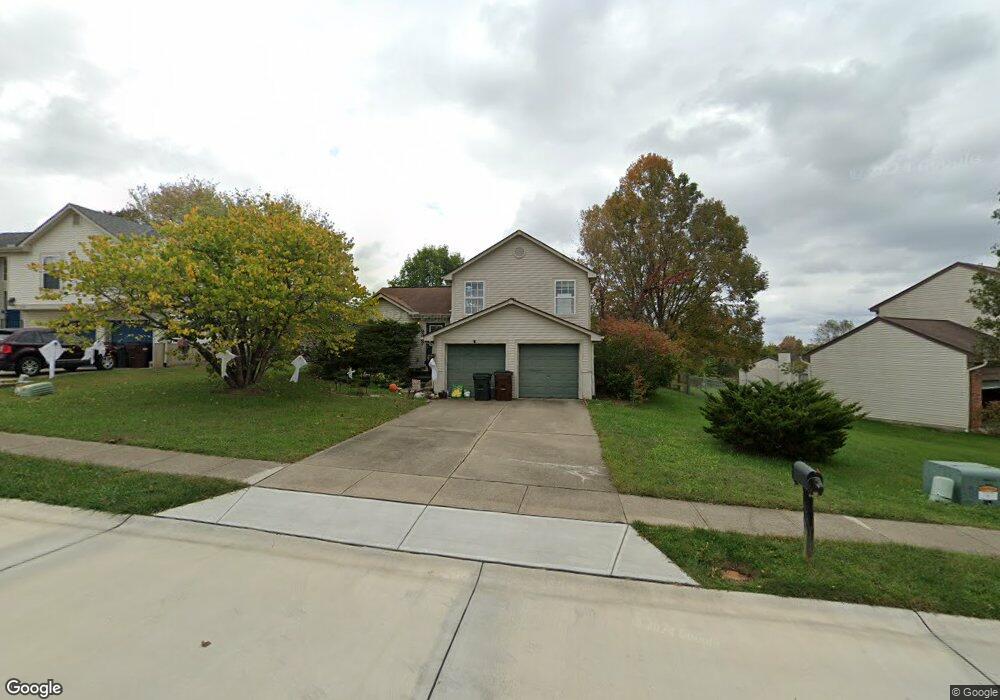
9987 Cobblestone Blvd Independence, KY 41051
Estimated Value: $241,000 - $283,000
3
Beds
2
Baths
976
Sq Ft
$269/Sq Ft
Est. Value
About This Home
This home is located at 9987 Cobblestone Blvd, Independence, KY 41051 and is currently estimated at $262,527, approximately $268 per square foot. 9987 Cobblestone Blvd is a home located in Kenton County with nearby schools including Beechgrove Elementary School, Simon Kenton High School, and St. Cecilia Catholic School.
Ownership History
Date
Name
Owned For
Owner Type
Purchase Details
Closed on
Jan 18, 2011
Sold by
Dalton Amanda and Mcmillen Dan
Bought by
Dalton Amanda
Current Estimated Value
Home Financials for this Owner
Home Financials are based on the most recent Mortgage that was taken out on this home.
Original Mortgage
$104,000
Outstanding Balance
$70,222
Interest Rate
4.58%
Mortgage Type
New Conventional
Estimated Equity
$192,305
Purchase Details
Closed on
Sep 25, 2001
Sold by
Burke Rick
Bought by
Mcmillen Dan and Dalton Amanda
Home Financials for this Owner
Home Financials are based on the most recent Mortgage that was taken out on this home.
Original Mortgage
$124,516
Interest Rate
6.97%
Mortgage Type
FHA
Purchase Details
Closed on
Nov 28, 1995
Sold by
Finke Homes Inc
Bought by
Burke Rick and Burke Mary
Home Financials for this Owner
Home Financials are based on the most recent Mortgage that was taken out on this home.
Original Mortgage
$93,000
Interest Rate
7.48%
Mortgage Type
New Conventional
Create a Home Valuation Report for This Property
The Home Valuation Report is an in-depth analysis detailing your home's value as well as a comparison with similar homes in the area
Home Values in the Area
Average Home Value in this Area
Purchase History
| Date | Buyer | Sale Price | Title Company |
|---|---|---|---|
| Dalton Amanda | -- | None Available | |
| Mcmillen Dan | $125,500 | -- | |
| Burke Rick | $93,000 | -- |
Source: Public Records
Mortgage History
| Date | Status | Borrower | Loan Amount |
|---|---|---|---|
| Open | Dalton Amanda | $104,000 | |
| Closed | Mcmillen Dan | $124,516 | |
| Previous Owner | Burke Rick | $93,000 |
Source: Public Records
Tax History
| Year | Tax Paid | Tax Assessment Tax Assessment Total Assessment is a certain percentage of the fair market value that is determined by local assessors to be the total taxable value of land and additions on the property. | Land | Improvement |
|---|---|---|---|---|
| 2025 | $2,328 | $200,200 | $35,000 | $165,200 |
| 2024 | $1,820 | $148,600 | $30,000 | $118,600 |
| 2023 | $1,875 | $148,600 | $30,000 | $118,600 |
| 2022 | $1,939 | $148,600 | $30,000 | $118,600 |
| 2021 | $1,967 | $148,600 | $30,000 | $118,600 |
| 2020 | $1,721 | $126,500 | $30,000 | $96,500 |
| 2019 | $1,725 | $126,500 | $30,000 | $96,500 |
| 2018 | $1,734 | $126,500 | $30,000 | $96,500 |
| 2017 | $1,688 | $126,500 | $30,000 | $96,500 |
| 2015 | $1,635 | $126,500 | $30,000 | $96,500 |
| 2014 | $1,613 | $126,500 | $30,000 | $96,500 |
Source: Public Records
Map
Nearby Homes
- 9877 Flagstone Dr
- 4106 Willowview Dr
- 4102 Willowview Dr
- 4109 Willowview Dr
- 4101 Willowview Dr
- 4312 Cobblewood Ct
- 1381 Poplartree Place
- 1077 Ivoryhill Dr
- 1058 Oakgrove Ct Unit 3
- 1070 Oakgrove Ct Unit 2
- 4268 Catalpa Dr
- 681 Hogrefe Rd
- 570 Old Bristow Rd
- 10362 Petersburg Ct
- 9980 Meadow Glen Dr
- 10654 Sinclair Dr
- 9971 Meadow Glen Dr
- 10690 Melbury Ct Unit 305GL
- 10700 Melbury Ct
- 1247 Monocacy Ct
- 9983 Cobblestone Blvd
- 9991 Cobblestone Blvd
- 9878 Liberty Ct
- 9979 Cobblestone Blvd
- 1263 Constitution Dr
- 1253 Constitution Dr
- 9874 Liberty Ct
- 9990 Cobblestone Blvd
- 9975 Cobblestone Blvd
- 9973 Cobblestone Blvd
- 9986 Cobblestone Blvd
- 9982 Cobblestone Blvd
- 9882 Liberty Ct
- 1267 Constitution Dr
- 1249 Constitution Dr
- 9978 Cobblestone Blvd
- 9974 Cobblestone Blvd
- 9969 Cobblestone Blvd
- 1227 Constitution Dr
- 1256 Constitution Dr
Your Personal Tour Guide
Ask me questions while you tour the home.