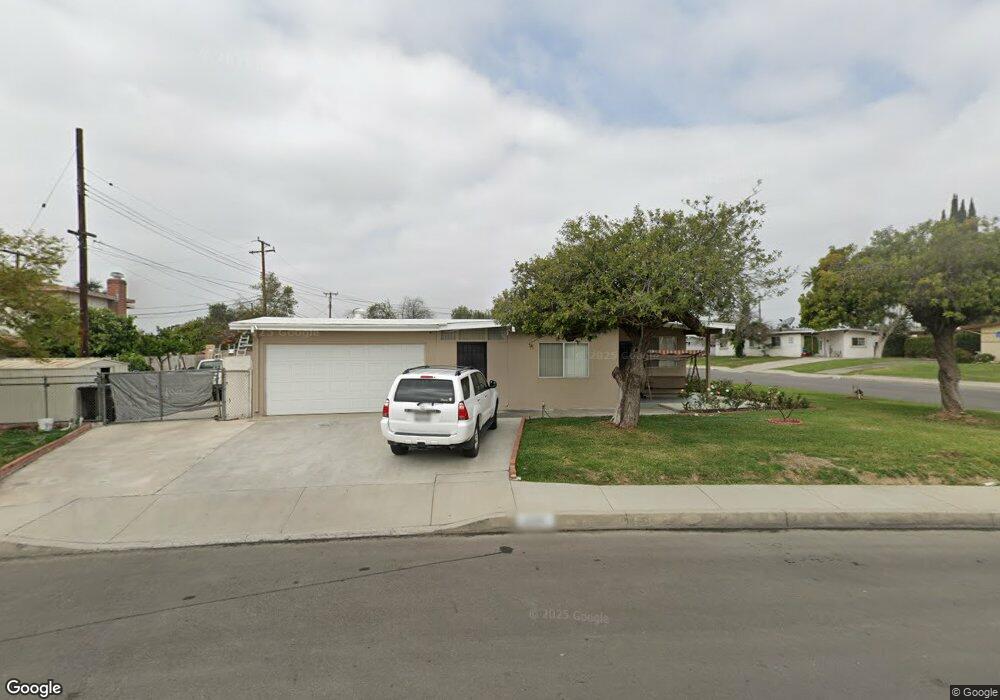
9988 Del Mar Ave Montclair, CA 91763
Estimated Value: $648,000 - $691,000
3
Beds
2
Baths
1,360
Sq Ft
$490/Sq Ft
Est. Value
About This Home
This home is located at 9988 Del Mar Ave, Montclair, CA 91763 and is currently estimated at $667,070, approximately $490 per square foot. 9988 Del Mar Ave is a home located in San Bernardino County with nearby schools including Elderberry Elementary, Vernon Middle School, and Montclair High School.
Ownership History
Date
Name
Owned For
Owner Type
Purchase Details
Closed on
Oct 16, 2023
Sold by
Vanpham John
Bought by
John Van Pham & Vi Thi Pham Living Trust and Van Pham
Current Estimated Value
Purchase Details
Closed on
Nov 3, 2018
Sold by
Pham Johnny Tran
Bought by
Vanpham John Van and Pham Leiah
Purchase Details
Closed on
Sep 11, 2015
Sold by
Vanpham John
Bought by
Vanpham John Van and Pham Johnny Tran
Purchase Details
Closed on
May 2, 2003
Sold by
Nguyen Hoa V
Bought by
Vanpham Khai and Pham Vi Thi
Home Financials for this Owner
Home Financials are based on the most recent Mortgage that was taken out on this home.
Original Mortgage
$165,000
Interest Rate
5.71%
Mortgage Type
Seller Take Back
Create a Home Valuation Report for This Property
The Home Valuation Report is an in-depth analysis detailing your home's value as well as a comparison with similar homes in the area
Home Values in the Area
Average Home Value in this Area
Purchase History
| Date | Buyer | Sale Price | Title Company |
|---|---|---|---|
| John Van Pham & Vi Thi Pham Living Trust | -- | None Listed On Document | |
| Vanpham John Van | -- | None Available | |
| Vanpham John Van | -- | Old Republic Title | |
| Vanpham Khai | $173,000 | Orange Coast Title |
Source: Public Records
Mortgage History
| Date | Status | Borrower | Loan Amount |
|---|---|---|---|
| Previous Owner | Vanpham Khai | $165,000 |
Source: Public Records
Tax History Compared to Growth
Tax History
| Year | Tax Paid | Tax Assessment Tax Assessment Total Assessment is a certain percentage of the fair market value that is determined by local assessors to be the total taxable value of land and additions on the property. | Land | Improvement |
|---|---|---|---|---|
| 2025 | $3,750 | $348,385 | $121,935 | $226,450 |
| 2024 | $3,750 | $341,554 | $119,544 | $222,010 |
| 2023 | $3,645 | $334,857 | $117,200 | $217,657 |
| 2022 | $3,597 | $328,291 | $114,902 | $213,389 |
| 2021 | $3,574 | $321,854 | $112,649 | $209,205 |
| 2020 | $3,512 | $318,554 | $111,494 | $207,060 |
| 2019 | $3,482 | $312,308 | $109,308 | $203,000 |
| 2018 | $3,065 | $280,101 | $98,420 | $181,681 |
| 2017 | $2,954 | $274,609 | $96,490 | $178,119 |
| 2016 | $2,836 | $269,224 | $94,598 | $174,626 |
| 2015 | $2,202 | $208,478 | $72,967 | $135,511 |
| 2014 | $2,132 | $204,395 | $71,538 | $132,857 |
Source: Public Records
Map
Nearby Homes
- 9932 Santa Anita Ave
- 827 N Jasmine Ave
- 853 N Jasmine Ave
- 9966 Vernon Ave
- 1352 W Granada Ct
- 1415 W Harvard Place
- 1516 W Stoneridge Ct
- 1164 W I St
- 1353 W Princeton St
- 5635 Palo Verde St
- 5156 June Mountain Dr
- 1326 W Oakcrest Paseo
- 1324 W Oakcrest Paseo
- 5573 Bonnie Brae St
- 456 N Begonia Ave
- Plan 3 at Canopy
- Plan 4 at Canopy
- 5141 Aspen Dr
- 1105 W Berkeley Ct
- 1111 W J St
- 5629 Denver St
- 10012 Del Mar Ave
- 10024 Del Mar Ave
- 5617 Denver St
- 5634 Denver St
- 9964 Del Mar Ave
- 9997 Del Mar Ave
- 9985 Del Mar Ave
- 5626 Denver St
- 10009 Del Mar Ave
- 10015 Santa Anita Ave
- 10036 Del Mar Ave
- 10021 Del Mar Ave
- 9973 Del Mar Ave
- 10005 Santa Anita Ave
- 5616 Denver St
- 5607 Denver St
- 5635 Granada St
- 10033 Del Mar Ave
- 9952 Del Mar Ave