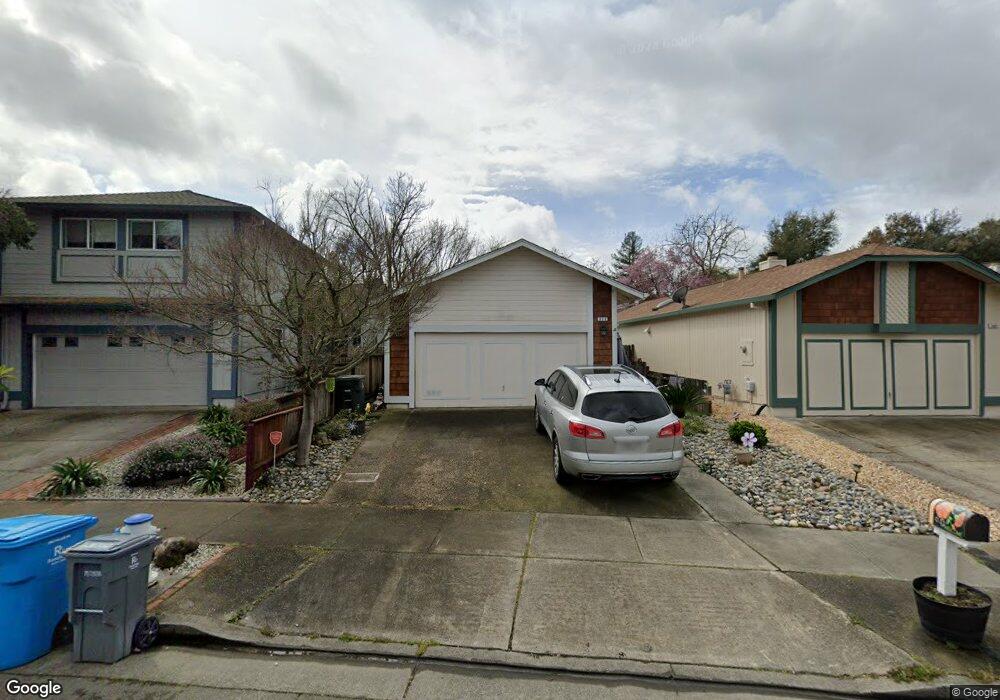
999 Stanislaus Way Unit 4 Santa Rosa, CA 95401
Copperfield NeighborhoodEstimated Value: $531,316 - $587,000
3
Beds
2
Baths
1,088
Sq Ft
$517/Sq Ft
Est. Value
About This Home
This home is located at 999 Stanislaus Way Unit 4, Santa Rosa, CA 95401 and is currently estimated at $562,829, approximately $517 per square foot. 999 Stanislaus Way Unit 4 is a home located in Sonoma County with nearby schools including Albert F. Biella Elementary School, Hilliard Comstock Middle School, and Santa Rosa High School.
Ownership History
Date
Name
Owned For
Owner Type
Purchase Details
Closed on
Apr 25, 2006
Sold by
Riedmuller Debra L
Bought by
Riedmuller Debra L
Current Estimated Value
Purchase Details
Closed on
Apr 23, 2003
Sold by
Buchan John P and Buchan Priscilla
Bought by
Riedmuller Debra L
Home Financials for this Owner
Home Financials are based on the most recent Mortgage that was taken out on this home.
Original Mortgage
$261,600
Outstanding Balance
$91,714
Interest Rate
3.25%
Estimated Equity
$471,115
Purchase Details
Closed on
Apr 15, 1996
Sold by
Buchan John P and Buchan Priscilla
Bought by
Buchan John P and Buchan Priscilla
Purchase Details
Closed on
Dec 27, 1995
Sold by
Hanson Glenn J and Hanson Carmella
Bought by
Buchan John P and Buchan Priscilla
Home Financials for this Owner
Home Financials are based on the most recent Mortgage that was taken out on this home.
Original Mortgage
$69,000
Interest Rate
7.37%
Create a Home Valuation Report for This Property
The Home Valuation Report is an in-depth analysis detailing your home's value as well as a comparison with similar homes in the area
Home Values in the Area
Average Home Value in this Area
Purchase History
| Date | Buyer | Sale Price | Title Company |
|---|---|---|---|
| Riedmuller Debra L | -- | None Available | |
| Riedmuller Debra L | $327,000 | First American Title Co | |
| Buchan John P | -- | -- | |
| Buchan John P | $138,000 | Northwestern Title Security |
Source: Public Records
Mortgage History
| Date | Status | Borrower | Loan Amount |
|---|---|---|---|
| Open | Riedmuller Debra L | $261,600 | |
| Previous Owner | Buchan John P | $69,000 | |
| Closed | Riedmuller Debra L | $45,400 |
Source: Public Records
Tax History Compared to Growth
Tax History
| Year | Tax Paid | Tax Assessment Tax Assessment Total Assessment is a certain percentage of the fair market value that is determined by local assessors to be the total taxable value of land and additions on the property. | Land | Improvement |
|---|---|---|---|---|
| 2025 | $5,264 | $473,593 | $144,824 | $328,769 |
| 2024 | $5,264 | $464,308 | $141,985 | $322,323 |
| 2023 | $5,264 | $455,204 | $139,201 | $316,003 |
| 2022 | $4,859 | $446,279 | $136,472 | $309,807 |
| 2021 | $4,799 | $437,530 | $133,797 | $303,733 |
| 2020 | $4,787 | $433,045 | $132,426 | $300,619 |
| 2019 | $4,761 | $424,555 | $129,830 | $294,725 |
| 2018 | $4,734 | $416,232 | $127,285 | $288,947 |
| 2017 | $4,648 | $408,072 | $124,790 | $283,282 |
| 2016 | $4,613 | $400,072 | $122,344 | $277,728 |
| 2015 | $3,920 | $346,000 | $106,000 | $240,000 |
| 2014 | $2,587 | $240,000 | $73,000 | $167,000 |
Source: Public Records
Map
Nearby Homes
- 234 Arboleda Dr
- 1185 Putney Dr
- 91 Westgate Cir
- 213 Monarch Ct
- 66 Somerset Dr
- 2318 S Hampton Cir
- 28 Westgate Cir
- 155 Shoreham Way
- 83 Somerset Dr
- 2467 College Park Cir
- 2333 Pacheco Place
- 23 Westgate Cir
- 2484 College Park Cir
- 167 Sequoia Cir
- 235 Regency Ct
- 224 Regency Ct
- 438 Rusty Dr
- 2400 Valley Dr W
- 127 Salisbury Cir
- 426 Secretariat Ct
- 1001 Stanislaus Way
- 997 Stanislaus Way
- 1003 Stanislaus Way
- 995 Stanislaus Way
- 993 Stanislaus Way
- 1005 Stanislaus Way
- 991 Stanislaus Way
- 998 Stanislaus Way
- 1007 Stanislaus Way
- 996 Stanislaus Way
- 1000 Stanislaus Way
- 989 Stanislaus Way
- 994 Stanislaus Way
- 992 Stanislaus Way
- 1012 Stanislaus Way
- 987 Stanislaus Way
- 1009 Stanislaus Way
- 990 Stanislaus Way
- 985 Stanislaus Way
- 1011 Stanislaus Way