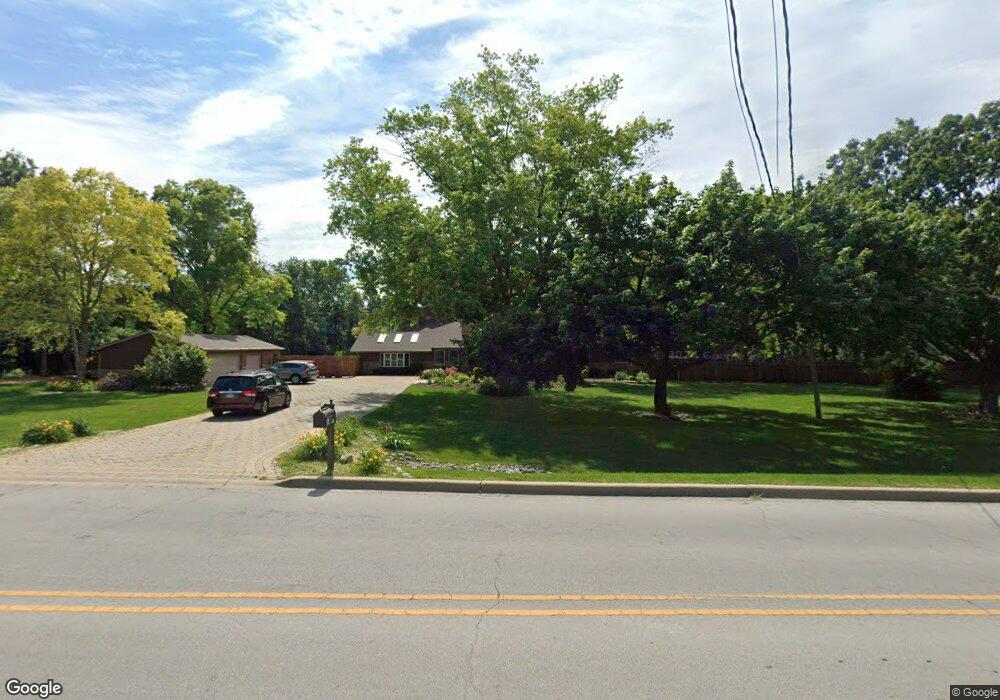
9S010 Modaff Rd Naperville, IL 60565
Springbrook Prairie NeighborhoodEstimated Value: $869,000 - $1,010,282
4
Beds
4
Baths
4,112
Sq Ft
$229/Sq Ft
Est. Value
About This Home
This home is located at 9S010 Modaff Rd, Naperville, IL 60565 and is currently estimated at $941,821, approximately $229 per square foot. 9S010 Modaff Rd is a home located in DuPage County with nearby schools including Owen Elementary School, Still Middle School, and Waubonsie Valley High School.
Ownership History
Date
Name
Owned For
Owner Type
Purchase Details
Closed on
May 1, 2019
Sold by
Schiro Kristine L and Kristine L Schiro Trust
Bought by
Schiro Loren F and Schiro Kristine L
Current Estimated Value
Purchase Details
Closed on
Feb 12, 2007
Sold by
Schiro Loren F and Schiro Kristine L
Bought by
Schiro Kristine L and Kristine L Schiro Trust
Purchase Details
Closed on
Aug 14, 2000
Sold by
Chicago Title Land Trust Company
Bought by
Schiro Loren F and Schiro Kristine L
Home Financials for this Owner
Home Financials are based on the most recent Mortgage that was taken out on this home.
Original Mortgage
$228,400
Outstanding Balance
$80,175
Interest Rate
8.16%
Estimated Equity
$861,646
Create a Home Valuation Report for This Property
The Home Valuation Report is an in-depth analysis detailing your home's value as well as a comparison with similar homes in the area
Home Values in the Area
Average Home Value in this Area
Purchase History
| Date | Buyer | Sale Price | Title Company |
|---|---|---|---|
| Schiro Loren F | -- | None Available | |
| Schiro Kristine L | -- | None Available | |
| Schiro Loren F | $285,500 | -- |
Source: Public Records
Mortgage History
| Date | Status | Borrower | Loan Amount |
|---|---|---|---|
| Open | Schiro Loren F | $228,400 |
Source: Public Records
Tax History
| Year | Tax Paid | Tax Assessment Tax Assessment Total Assessment is a certain percentage of the fair market value that is determined by local assessors to be the total taxable value of land and additions on the property. | Land | Improvement |
|---|---|---|---|---|
| 2024 | $14,640 | $269,934 | $82,633 | $187,301 |
| 2023 | $13,980 | $239,900 | $74,250 | $165,650 |
| 2022 | $14,352 | $237,440 | $73,440 | $164,000 |
| 2021 | $13,856 | $228,970 | $70,820 | $158,150 |
| 2020 | $13,836 | $228,970 | $70,820 | $158,150 |
| 2019 | $13,308 | $217,780 | $67,360 | $150,420 |
| 2018 | $15,001 | $239,650 | $71,270 | $168,380 |
| 2017 | $14,629 | $231,520 | $68,850 | $162,670 |
| 2016 | $14,372 | $222,180 | $66,070 | $156,110 |
| 2015 | $14,243 | $210,950 | $62,730 | $148,220 |
| 2014 | $14,639 | $210,590 | $62,170 | $148,420 |
| 2013 | $14,637 | $212,050 | $62,600 | $149,450 |
Source: Public Records
Map
Nearby Homes
- 628 Flock Ave Unit 3
- 289 Winding Creek Dr
- 534 Grimes Ave
- 332 Prairie Knoll Dr
- 381 Prairie Knoll Dr
- 48 Starling Ln
- 1033 Emerald Dr
- 313 W Gartner Rd
- 316 Sycamore Dr Unit 11
- 316 Hemlock Ln
- 2221 Woodland Cir
- 2057 Lancaster Cir Unit 101C
- 1754 S Washington St Unit 1754
- 2245 Petworth Ct Unit 202C
- 2308 Modaff Rd
- 2307 Woodview Ln
- 845 Tulip Ln
- 95 Midhurst Ct Unit 101
- 47 Glencoe Ct Unit 102D
- 96 Midhurst Ct Unit 201
Your Personal Tour Guide
Ask me questions while you tour the home.