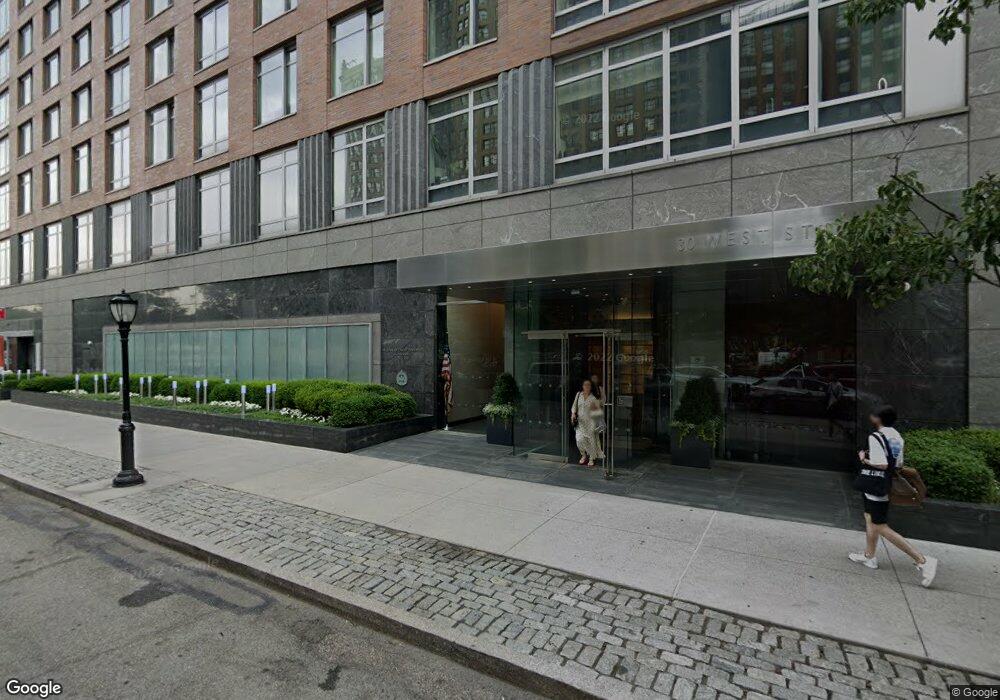
Millennium Tower Residences 30 West St Unit 33E New York, NY 10004
Battery Park NeighborhoodEstimated Value: $1,912,000 - $2,525,000
2
Beds
2
Baths
1,526
Sq Ft
$1,495/Sq Ft
Est. Value
About This Home
This home is located at 30 West St Unit 33E, New York, NY 10004 and is currently estimated at $2,280,672, approximately $1,494 per square foot. 30 West St Unit 33E is a home located in New York County with nearby schools including Battery Park City School, Lower Manhattan Community Middle School, and Middle School 297.
Ownership History
Date
Name
Owned For
Owner Type
Purchase Details
Closed on
Dec 19, 2016
Sold by
Nova Terra Development Group Llc
Bought by
Moses Helen Gaussen and Moses Robert
Current Estimated Value
Purchase Details
Closed on
May 17, 2007
Sold by
Gutierrez Edgar and Henriquez Victor
Bought by
Nova Terra Development Group Llc
Home Financials for this Owner
Home Financials are based on the most recent Mortgage that was taken out on this home.
Original Mortgage
$1,288,000
Interest Rate
6.27%
Mortgage Type
Purchase Money Mortgage
Purchase Details
Closed on
May 11, 2007
Sold by
Millennium Bpc Ii Development Llc and % Millennium Partners Llc
Bought by
Gutierrez Edgar and Henriquez Victor
Home Financials for this Owner
Home Financials are based on the most recent Mortgage that was taken out on this home.
Original Mortgage
$1,288,000
Interest Rate
6.27%
Mortgage Type
Purchase Money Mortgage
Create a Home Valuation Report for This Property
The Home Valuation Report is an in-depth analysis detailing your home's value as well as a comparison with similar homes in the area
Home Values in the Area
Average Home Value in this Area
Purchase History
| Date | Buyer | Sale Price | Title Company |
|---|---|---|---|
| Moses Helen Gaussen | $2,550,000 | -- | |
| Nova Terra Development Group Llc | -- | -- | |
| Nova Terra Development Group Llc | -- | -- | |
| Gutierrez Edgar | $1,610,000 | -- | |
| Gutierrez Edgar | $1,610,000 | -- |
Source: Public Records
Mortgage History
| Date | Status | Borrower | Loan Amount |
|---|---|---|---|
| Previous Owner | Gutierrez Edgar | $1,288,000 |
Source: Public Records
Tax History Compared to Growth
Tax History
| Year | Tax Paid | Tax Assessment Tax Assessment Total Assessment is a certain percentage of the fair market value that is determined by local assessors to be the total taxable value of land and additions on the property. | Land | Improvement |
|---|---|---|---|---|
| 2025 | -- | $257,201 | $21,367 | $235,834 |
| 2024 | -- | $251,426 | $21,367 | $230,059 |
| 2023 | $0 | $248,475 | $21,367 | $227,108 |
| 2022 | $0 | $245,071 | $21,367 | $223,704 |
| 2021 | $0 | $232,613 | $21,367 | $211,246 |
| 2020 | $0 | $257,530 | $21,367 | $236,163 |
| 2019 | $0 | $251,740 | $21,367 | $230,373 |
| 2018 | $0 | $250,023 | $21,368 | $228,655 |
| 2017 | $0 | $249,086 | $21,368 | $227,718 |
| 2016 | $0 | $246,706 | $21,368 | $225,338 |
| 2015 | -- | $206,748 | $21,367 | $185,381 |
| 2014 | -- | $209,526 | $21,367 | $188,159 |
Source: Public Records
About Millennium Tower Residences
Map
Nearby Homes
- 30 West St Unit 3B
- 30 West St Unit 25G
- 30 West St Unit 20F
- 30 West St Unit 22 E
- 30 West St Unit 31G
- 30 Little St W Unit 4G
- 10 Little St W Unit 27-B
- 10 Little St W Unit 16A
- 10 Little St W Unit 18-A
- 10 Little St W Unit 35C
- 10 West St Unit 27B
- 10 West St Unit 20G
- 70 Little St W Unit 20 B
- 70 Little St W Unit 5C
- 70 Little St W Unit 11 M
- 70 Little West St Unit 22G
- 70 Little West St Unit 32E
- 70 Little West St Unit 9A
- 70 Little St W Unit 33-E
- 70 Little St W Unit 7-H
- 30 West St Unit 26G
- 30 West St Unit Ph1-B
- 30 West St Unit 6E
- 30 West St Unit 702
- 30 West St Unit 1407
- 30 West St Unit 3004
- 30 West St Unit 7G
- 30 West St Unit 20-D
- 30 West St Unit 25-A
- 30 West St Unit 33-G
- 30 West St Unit 29-B
- 30 West St Unit 25D
- 30 West St Unit 3-F
- 30 West St Unit 31-C
- 30 West St Unit PH3B
- 30 West St Unit 19D
- 30 West St Unit 7F
- 30 West St Unit 18DE
- 30 West St Unit 18G