
Landlord's Agent in 2017
Michelle Collingbourne
RE/MAX
(630) 688-8207
3 in this area
192 Total Sales


Estimated Value: $635,000 - $670,000
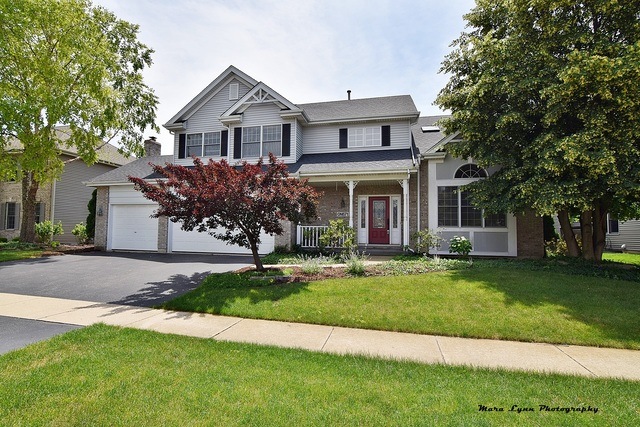
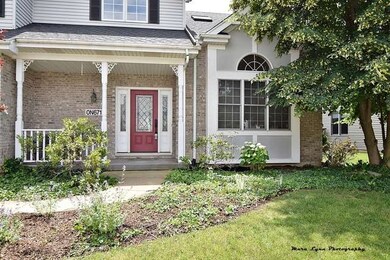
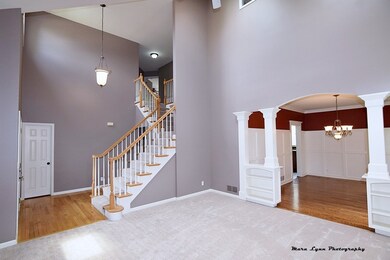
Fantastic 2 story with huge addition offering designer gourmet kitchen. Owner spent thousands on the expansion of this beautiful home in Mill Creek. Very open floor plan includes Vaulted living room/formal dining room with hardwood floors, Gourmet kitchen with island opens to family room, slate floor, walk-in pantry, top of the line SS appliances, Back hall with built ins, powder room, & service closet. Second floor includes Master bedroom suite and 3 additional bedrooms. Full finished basement with Rec area, second kitchen/bar area, 1/2 bath, 5th bedroom, plus a separate office. Private backyard with brick paver patios and walkways. 3 car garage! Also for rent at $3550 a month. This home will surprise you!
Last Agent to Rent the Property
RE/MAX All Pro - St Charles License #475142210 Listed on: 07/21/2017
| Date | Buyer | Sale Price | Title Company |
|---|---|---|---|
| Manny Dave | $530,000 | Chicago Title | |
| Rote Robert | $321,000 | -- | |
| Kim John H | $290,000 | Chicago Title Insurance Co | |
| Sho Deen Inc | -- | -- |
| Date | Status | Borrower | Loan Amount |
|---|---|---|---|
| Open | Manny Dave | $424,000 | |
| Previous Owner | Rote Robert | $256,800 | |
| Previous Owner | Kim John H | $227,150 | |
| Closed | Kim John H | $33,625 | |
| Closed | Rote Robert | $32,100 |
| Date | Event | Price | List to Sale | Price per Sq Ft |
|---|---|---|---|---|
| 10/01/2017 10/01/17 | Rented | $3,250 | 0.0% | -- |
| 08/30/2017 08/30/17 | Price Changed | $3,250 | -5.8% | $1 / Sq Ft |
| 08/09/2017 08/09/17 | Price Changed | $3,450 | -2.8% | $1 / Sq Ft |
| 07/21/2017 07/21/17 | For Rent | $3,550 | -- | -- |
| Year | Tax Paid | Tax Assessment Tax Assessment Total Assessment is a certain percentage of the fair market value that is determined by local assessors to be the total taxable value of land and additions on the property. | Land | Improvement |
|---|---|---|---|---|
| 2024 | $14,385 | $181,155 | $30,182 | $150,973 |
| 2023 | $13,892 | $163,497 | $27,240 | $136,257 |
| 2022 | $13,292 | $151,986 | $25,000 | $126,986 |
| 2021 | $12,852 | $145,469 | $23,928 | $121,541 |
| 2020 | $12,489 | $142,059 | $23,367 | $118,692 |
| 2019 | $12,445 | $139,973 | $23,024 | $116,949 |
| 2018 | $12,480 | $140,670 | $23,024 | $117,646 |
| 2017 | $1,247,084 | $139,070 | $22,762 | $116,308 |
| 2016 | $12,559 | $138,977 | $22,161 | $116,816 |
| 2015 | -- | $129,621 | $21,296 | $108,325 |
| 2014 | -- | $122,386 | $23,697 | $98,689 |
| 2013 | -- | $122,386 | $23,697 | $98,689 |
Landlord's Agent in 2017
Michelle Collingbourne
RE/MAX
(630) 688-8207
3 in this area
192 Total Sales
Tenant's Agent in 2017
Peggy Cain
Karen Douglas Realty
(630) 269-6945
4 in this area
39 Total Sales
Source: Midwest Real Estate Data (MRED)
MLS Number: MRD09698058
APN: 11-12-253-004
Disclaimer: Certain information contained herein is derived from information provided by parties other than Homes.com. All information provided is deemed reliable, but is not guaranteed to be accurate and should be independently verified.
![]() Based on information submitted to the MLS GRID. All data is obtained from various sources and may not have been verified by broker or MLS GRID. Supplied Open House Information is subject to change without notice. All information should be independently reviewed and verified for accuracy. Properties may or may not be listed by the office/agent presenting the information. Some IDX listings have been excluded from this website.
Based on information submitted to the MLS GRID. All data is obtained from various sources and may not have been verified by broker or MLS GRID. Supplied Open House Information is subject to change without notice. All information should be independently reviewed and verified for accuracy. Properties may or may not be listed by the office/agent presenting the information. Some IDX listings have been excluded from this website.
The Digital Millennium Copyright Act of 1998, 17 U.S.C. § 512 (the “DMCA”) provides recourse for copyright owners who believe that material appearing on the Internet infringes their rights under U.S. copyright law. If you believe in good faith that any content or material made available in connection with our website or services infringes your copyright, you (or your agent) may send us a notice requesting that the content or material be removed, or access to it blocked.
Notices must be sent in writing by email to DMCAnotice@MLSGrid.com.
The DMCA requires that your notice of alleged copyright infringement include the following information:
(1) description of the copyrighted work that is the subject of claimed infringement;
(2) description of the alleged infringing content and information sufficient to permit us to locate the content;
(3) contact information for you, including your address, telephone number and email address;
(4) a statement by you that you have a good faith belief that the content in the manner complained of is not authorized by the copyright owner, or its agent, or by the operation of any law;
(5) a statement by you, signed under penalty of perjury, that the information in the notification is accurate and that you have the authority to enforce the copyrights that are claimed to be infringed; and
(6) a physical or electronic signature of the copyright owner or a person authorized to act on the copyright owner’s behalf. Failure to include all of the above information may result in the delay of the processing of your complaint.