
Seller's Agent in 2021
Virginia Jacobs
ERA Kings Bay Realty
(912) 552-4766
135 Total Sales
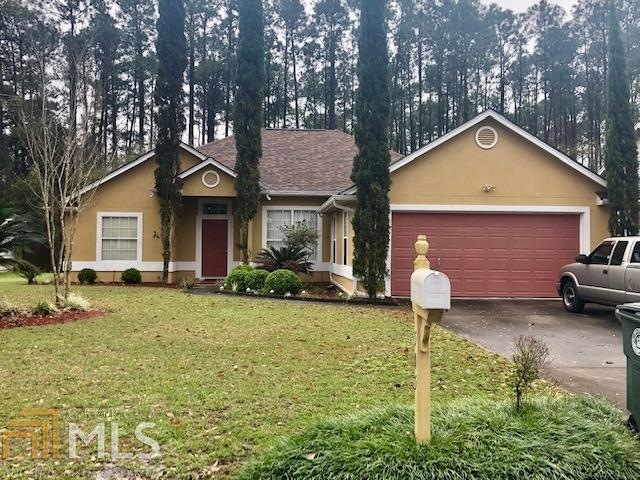
Come tour this beautiful, maintained home in Lake Jordan West! Features an open kitchen and living room floor plan with split bedrooms. The back yard is partially fenced, and includes a well-built tile patio and storage outbuilding. This home will not last, call today to show!
Last Agent to Sell the Property
RE/MAX First Coast License #167010 Listed on: 03/09/2021
Home Type
Est. Annual Taxes
Year Built
Lot Details
Home Design
Bedrooms and Bathrooms
Utilities
| Date | Event | Price | Change | Sq Ft Price |
|---|---|---|---|---|
| 06/02/2021 06/02/21 | Sold | $210,000 | -4.1% | $131 / Sq Ft |
| 04/30/2021 04/30/21 | Sold | $219,000 | +4.5% | $127 / Sq Ft |
| 04/30/2021 04/30/21 | Pending | -- | -- | -- |
| 04/29/2021 04/29/21 | For Sale | $209,500 | -8.5% | $130 / Sq Ft |
| 03/11/2021 03/11/21 | Pending | -- | -- | -- |
| 03/09/2021 03/09/21 | For Sale | $229,000 | -6.1% | $133 / Sq Ft |
| 06/26/2020 06/26/20 | Sold | $243,900 | 0.0% | $103 / Sq Ft |
| 05/22/2020 05/22/20 | Pending | -- | -- | -- |
| 05/19/2020 05/19/20 | For Sale | $243,900 | +43.9% | $103 / Sq Ft |
| 03/27/2020 03/27/20 | Sold | $169,500 | -23.0% | $120 / Sq Ft |
| 02/15/2020 02/15/20 | Pending | -- | -- | -- |
| 02/13/2020 02/13/20 | Sold | $220,000 | +29.8% | $80 / Sq Ft |
| 02/12/2020 02/12/20 | For Sale | $169,500 | 0.0% | $120 / Sq Ft |
| 02/03/2020 02/03/20 | Pending | -- | -- | -- |
| 02/03/2020 02/03/20 | For Sale | $169,500 | -26.3% | $120 / Sq Ft |
| 01/12/2020 01/12/20 | Pending | -- | -- | -- |
| 12/12/2019 12/12/19 | For Sale | $230,000 | +48.4% | $84 / Sq Ft |
| 09/16/2019 09/16/19 | Sold | $155,000 | 0.0% | $106 / Sq Ft |
| 09/10/2019 09/10/19 | Rented | $1,250 | 0.0% | -- |
| 08/19/2019 08/19/19 | Off Market | $1,250 | -- | -- |
| 08/16/2019 08/16/19 | For Rent | $1,250 | 0.0% | -- |
| 07/31/2019 07/31/19 | Sold | $180,000 | +11.5% | $122 / Sq Ft |
| 07/28/2019 07/28/19 | Pending | -- | -- | -- |
| 07/24/2019 07/24/19 | Price Changed | $161,500 | -0.3% | $111 / Sq Ft |
| 06/29/2019 06/29/19 | Pending | -- | -- | -- |
| 06/24/2019 06/24/19 | Price Changed | $162,000 | -10.0% | $111 / Sq Ft |
| 06/24/2019 06/24/19 | For Sale | $180,000 | +16.1% | $122 / Sq Ft |
| 06/08/2019 06/08/19 | Price Changed | $155,000 | -3.1% | $106 / Sq Ft |
| 05/05/2019 05/05/19 | For Sale | $159,900 | -10.7% | $109 / Sq Ft |
| 01/07/2019 01/07/19 | Sold | $179,000 | -3.2% | $87 / Sq Ft |
| 12/20/2018 12/20/18 | Sold | $185,000 | -2.6% | $81 / Sq Ft |
| 11/27/2018 11/27/18 | Pending | -- | -- | -- |
| 11/04/2018 11/04/18 | Pending | -- | -- | -- |
| 10/18/2018 10/18/18 | For Sale | $190,000 | +5.6% | $83 / Sq Ft |
| 09/17/2018 09/17/18 | Price Changed | $180,000 | -2.7% | $88 / Sq Ft |
| 08/31/2018 08/31/18 | For Sale | $185,000 | -6.6% | $90 / Sq Ft |
| 05/09/2018 05/09/18 | Sold | $198,000 | +14247.8% | $83 / Sq Ft |
| 04/04/2018 04/04/18 | Pending | -- | -- | -- |
| 04/02/2018 04/02/18 | Rented | $1,380 | 0.0% | -- |
| 03/29/2018 03/29/18 | For Sale | $198,000 | +14247.8% | $83 / Sq Ft |
| 03/02/2018 03/02/18 | Pending | -- | -- | -- |
| 02/06/2018 02/06/18 | For Rent | $1,380 | 0.0% | -- |
| 01/19/2018 01/19/18 | For Sale | $198,000 | 0.0% | $83 / Sq Ft |
| 11/10/2017 11/10/17 | Rented | $1,075 | 0.0% | -- |
| 10/30/2017 10/30/17 | Price Changed | $1,075 | -2.3% | $1 / Sq Ft |
| 10/23/2017 10/23/17 | For Rent | $1,100 | 0.0% | -- |
| 07/14/2017 07/14/17 | Sold | $185,000 | -2.6% | $75 / Sq Ft |
| 05/30/2017 05/30/17 | Pending | -- | -- | -- |
| 03/08/2017 03/08/17 | For Sale | $189,900 | 0.0% | $77 / Sq Ft |
| 03/03/2017 03/03/17 | Pending | -- | -- | -- |
| 03/01/2017 03/01/17 | For Sale | $189,900 | +2.6% | $77 / Sq Ft |
| 03/01/2017 03/01/17 | Off Market | $185,000 | -- | -- |
| 02/17/2017 02/17/17 | Rented | $1,325 | +15.2% | -- |
| 02/15/2017 02/15/17 | Rented | $1,150 | 0.0% | -- |
| 02/13/2017 02/13/17 | For Sale | $189,900 | +2.6% | $77 / Sq Ft |
| 02/11/2017 02/11/17 | Off Market | $185,000 | -- | -- |
| 02/09/2017 02/09/17 | Sold | $152,500 | 0.0% | $94 / Sq Ft |
| 01/17/2017 01/17/17 | For Rent | $1,150 | -13.2% | -- |
| 01/09/2017 01/09/17 | Price Changed | $1,325 | 0.0% | $1 / Sq Ft |
| 01/04/2017 01/04/17 | Pending | -- | -- | -- |
| 12/07/2016 12/07/16 | Price Changed | $154,900 | 0.0% | $96 / Sq Ft |
| 12/02/2016 12/02/16 | For Rent | $1,350 | +22.7% | -- |
| 10/07/2016 10/07/16 | Rented | $1,100 | 0.0% | -- |
| 09/13/2016 09/13/16 | For Rent | $1,100 | 0.0% | -- |
| 08/15/2016 08/15/16 | Price Changed | $153,000 | -19.4% | $94 / Sq Ft |
| 07/20/2016 07/20/16 | For Sale | $189,900 | +20.6% | $77 / Sq Ft |
| 06/28/2016 06/28/16 | For Sale | $157,500 | +1.0% | $97 / Sq Ft |
| 02/10/2015 02/10/15 | Sold | $156,000 | -2.5% | $61 / Sq Ft |
| 12/23/2014 12/23/14 | Pending | -- | -- | -- |
| 12/01/2014 12/01/14 | For Sale | $159,932 | -- | $62 / Sq Ft |
| Year | Tax Paid | Tax Assessment Tax Assessment Total Assessment is a certain percentage of the fair market value that is determined by local assessors to be the total taxable value of land and additions on the property. | Land | Improvement |
|---|---|---|---|---|
| 2024 | $483 | $14,000 | $14,000 | $0 |
| 2023 | $345 | $10,000 | $10,000 | $0 |
| 2022 | $358 | $10,000 | $10,000 | $0 |
| 2021 | $383 | $10,000 | $10,000 | $0 |
| 2020 | $398 | $10,000 | $10,000 | $0 |
| 2019 | $398 | $10,000 | $10,000 | $0 |
| 2018 | $81 | $10,000 | $10,000 | $0 |
| 2017 | $339 | $10,000 | $10,000 | $0 |
| 2016 | $12 | $400 | $400 | $0 |
| 2015 | $15 | $400 | $400 | $0 |
| 2014 | $188 | $6,000 | $6,000 | $0 |
Seller's Agent in 2021
Virginia Jacobs
ERA Kings Bay Realty
(912) 552-4766
135 Total Sales
Seller's Agent in 2021
Debby Jones
RE/MAX
(912) 674-7653
109 Total Sales
Buyer's Agent in 2021
Jessica Morla
Watson Realty Corp
(561) 319-5181
139 Total Sales
Buyer's Agent in 2021
Debbie Judge
Coldwell Banker Platinum Partners
(912) 552-5877
174 Total Sales
Seller's Agent in 2020
Vikki Josselyn
Josselyn Realty Group, LLC
Seller's Agent in 2020
Joy Cooper
ERA Kings Bay Realty
(912) 674-9316
187 Total Sales
Source: Georgia MLS
MLS Number: 8940568
APN: 107S000049
Disclaimer: Certain information contained herein is derived from information provided by parties other than Homes.com. All information provided is deemed reliable, but is not guaranteed to be accurate and should be independently verified.
![]() The data relating to real estate for sale on this web site comes in part from the Broker Reciprocity Program of Georgia MLS. Real estate listings held by brokerage firms other than Redfin are marked with the Broker Reciprocity logo and detailed information about them includes the name of the listing brokers. Information deemed reliable but not guaranteed. Copyright 2025 Georgia MLS. All rights reserved.
The data relating to real estate for sale on this web site comes in part from the Broker Reciprocity Program of Georgia MLS. Real estate listings held by brokerage firms other than Redfin are marked with the Broker Reciprocity logo and detailed information about them includes the name of the listing brokers. Information deemed reliable but not guaranteed. Copyright 2025 Georgia MLS. All rights reserved.