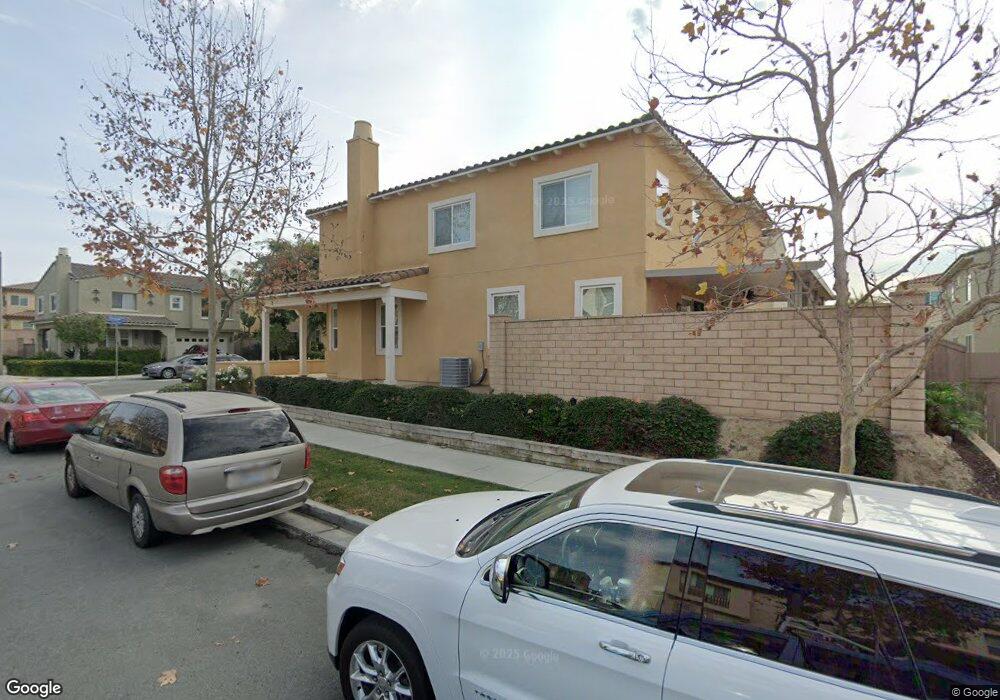
0 Room for Rent Unit 1334 190004076 Chula Vista, CA 91913
Otay Ranch NeighborhoodEstimated Value: $530,000 - $564,000
1
Bed
1
Bath
959
Sq Ft
$562/Sq Ft
Est. Value
About This Home
This home is located at 0 Room for Rent Unit 1334 190004076, Chula Vista, CA 91913 and is currently estimated at $539,175, approximately $562 per square foot. 0 Room for Rent Unit 1334 190004076 is a home located in San Diego County with nearby schools including Veterans Elementary School, Rancho Del Rey Middle School, and Olympian High School.
Ownership History
Date
Name
Owned For
Owner Type
Purchase Details
Closed on
May 1, 2023
Sold by
Johnson Rudolph A and Johnson Sheryl P
Bought by
Johnson Family Trust
Current Estimated Value
Purchase Details
Closed on
Aug 9, 2016
Sold by
Scott Nachelle D
Bought by
Johnson Rudolph A and Johnson Sheryl P
Home Financials for this Owner
Home Financials are based on the most recent Mortgage that was taken out on this home.
Original Mortgage
$212,000
Interest Rate
3.43%
Mortgage Type
New Conventional
Purchase Details
Closed on
Aug 28, 2009
Sold by
Pathfinder Chula Vista Sea Sun Llc
Bought by
Scott Nachelle D
Home Financials for this Owner
Home Financials are based on the most recent Mortgage that was taken out on this home.
Original Mortgage
$203,176
Interest Rate
5.2%
Mortgage Type
VA
Purchase Details
Closed on
Aug 15, 2008
Sold by
Otay Ranch R-8-2 Llc
Bought by
Pathfinder Chula Vista Sea Sun Llc
Create a Home Valuation Report for This Property
The Home Valuation Report is an in-depth analysis detailing your home's value as well as a comparison with similar homes in the area
Home Values in the Area
Average Home Value in this Area
Purchase History
| Date | Buyer | Sale Price | Title Company |
|---|---|---|---|
| Johnson Family Trust | -- | None Listed On Document | |
| Johnson Rudolph A | $265,000 | First American Title | |
| Scott Nachelle D | $199,000 | Fidelity National Title Co | |
| Pathfinder Chula Vista Sea Sun Llc | -- | Stewart Title Of California |
Source: Public Records
Mortgage History
| Date | Status | Borrower | Loan Amount |
|---|---|---|---|
| Previous Owner | Johnson Rudolph A | $212,000 | |
| Previous Owner | Scott Nachelle D | $203,176 |
Source: Public Records
Tax History Compared to Growth
Tax History
| Year | Tax Paid | Tax Assessment Tax Assessment Total Assessment is a certain percentage of the fair market value that is determined by local assessors to be the total taxable value of land and additions on the property. | Land | Improvement |
|---|---|---|---|---|
| 2025 | $5,296 | $307,547 | $119,601 | $187,946 |
| 2024 | $5,296 | $301,517 | $117,256 | $184,261 |
| 2023 | $5,360 | $295,606 | $114,957 | $180,649 |
| 2022 | $5,226 | $289,810 | $112,703 | $177,107 |
| 2021 | $5,106 | $284,129 | $110,494 | $173,635 |
| 2020 | $5,009 | $281,217 | $109,362 | $171,855 |
| 2019 | $4,905 | $275,704 | $107,218 | $168,486 |
| 2018 | $4,907 | $270,299 | $105,116 | $165,183 |
| 2017 | $4,826 | $265,000 | $103,055 | $161,945 |
| 2016 | $4,150 | $216,877 | $84,341 | $132,536 |
| 2015 | $4,067 | $213,621 | $83,075 | $130,546 |
| 2014 | $3,943 | $209,437 | $81,448 | $127,989 |
Source: Public Records
Map
Nearby Homes
- 1875 Baudouin Place Unit 1731
- 1295 Haglar Way Unit 1
- 1433 Vallejo Mills St Unit 1
- 1284 Haglar Way Unit 1
- 1280 Haglar Way Unit 2
- 1873 Fargo Ln Unit 4
- 1401 Caminito Capistrano Unit 1
- 1459 Sutter Buttes St
- 1285 Fools Gold Way Unit 2
- 1915 Caminito de la Cruz
- 1448 Water Lily Dr Unit 1
- 1279 Fools Gold Way Unit 2
- 1440 Levant Ln Unit 1
- 1271 Gorge Run Way Unit 3
- 1452 Canvas Dr Unit 1
- 779 Caminito Francisco Unit 1
- 1548 Hunters Glen Ave
- 1450 Suwerte Ave
- 1760 E Palomar St Unit 318
- 1760 E Palomar St Unit 111
- 1853 Rue Bienville Place
- 1372 Nicolette Ave
- 1864 Opaline Place Unit Mer Soleil Condo
- 1350 La Rochelle Ave
- 1853 Rue Bienville Place
- 1355 Nicolette Ave
- 1360 La Rochelle Ave
- 1344 Paizay Place
- 1894 Lorient Place
- 1875 Cannes Place
- 1388 Challis Place
- 1890 Chambery Place
- 1346 Nicolette Ave
- 1886 Nantes Place
- 1864 Opaline Place
- 1893 Lorient Place Unit 2326
- 1355 Nicolette Ave Unit 2021
- 1894 Lorient Place Unit 2436
- 1893 Lorient Place Unit 2332
- 1894 Lorient Place Unit 2425