Estimated Value: $195,000 - $335,459
3
Beds
2
Baths
1,350
Sq Ft
$184/Sq Ft
Est. Value
About This Home
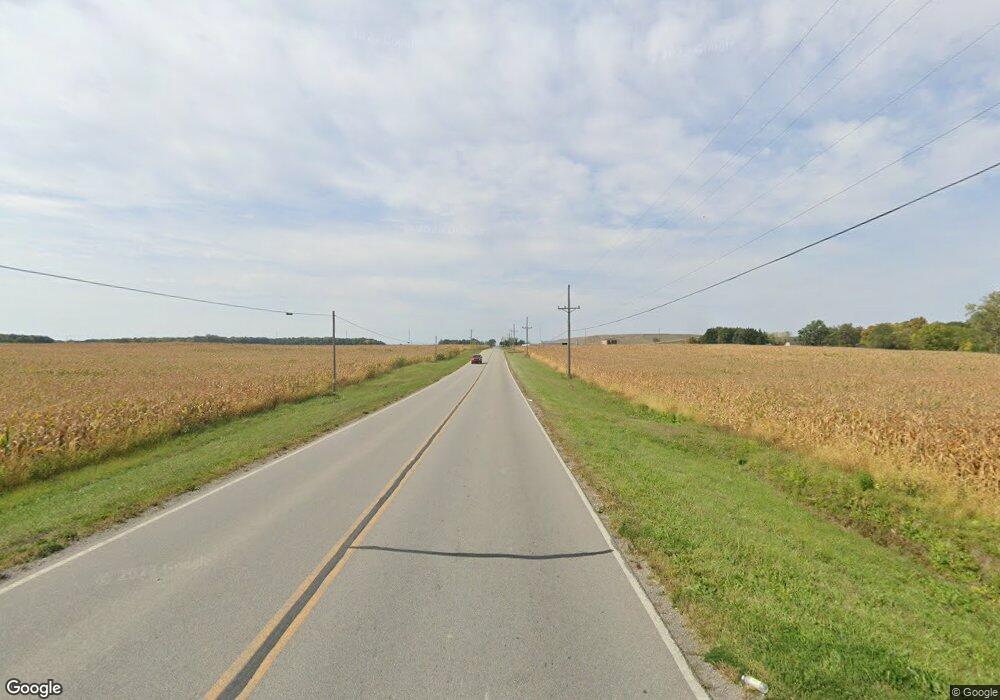
This home is located at 0 Williams County G Unit 5081216, Bryan, OH 43506 and is currently estimated at $247,865, approximately $183 per square foot. 0 Williams County G Unit 5081216 is a home located in Williams County with nearby schools including Montpelier Elementary School and Montpelier High School.
Ownership History
Date
Name
Owned For
Owner Type
Purchase Details
Closed on
Nov 4, 2021
Sold by
Jinkins Danny R and Jinkins Peggy L
Bought by
Jinkins Danny R and Jinkins Peggy L
Current Estimated Value
Purchase Details
Closed on
Dec 16, 2016
Sold by
Davis Allan and Davis Dawn
Bought by
Jinkins Danny R and Jinkins Peegy L
Purchase Details
Closed on
Dec 30, 2014
Sold by
S Mohre Investments Llc
Bought by
Davis Allan and Davis Dawn
Purchase Details
Closed on
Oct 15, 2013
Sold by
Skovmand Pam and Skovmand Timothy J
Bought by
S Mohre Investments Llc
Purchase Details
Closed on
Apr 14, 2010
Sold by
Shadley Gwen
Bought by
Skovmand Pam
Purchase Details
Closed on
Feb 4, 2003
Sold by
Duncan Mary
Bought by
Skovmand Pam
Purchase Details
Closed on
Jan 1, 1990
Sold by
Skovmand Pam
Bought by
Shadley Gwen
Create a Home Valuation Report for This Property
The Home Valuation Report is an in-depth analysis detailing your home's value as well as a comparison with similar homes in the area
Home Values in the Area
Average Home Value in this Area
Purchase History
| Date | Buyer | Sale Price | Title Company |
|---|---|---|---|
| Jinkins Danny R | -- | None Available | |
| Jinkins Danny R | $19,000 | Preservation Title Ltd | |
| Davis Allan | $22,500 | None Available | |
| Davis Allan | $22,500 | None Available | |
| S Mohre Investments Llc | $20,000 | None Available | |
| Skovmand Pam | -- | None Available | |
| Skovmand Pam | -- | -- | |
| Shadley Gwen | -- | -- |
Source: Public Records
Tax History Compared to Growth
Tax History
| Year | Tax Paid | Tax Assessment Tax Assessment Total Assessment is a certain percentage of the fair market value that is determined by local assessors to be the total taxable value of land and additions on the property. | Land | Improvement |
|---|---|---|---|---|
| 2024 | $3,025 | $96,500 | $13,550 | $82,950 |
| 2023 | $3,025 | $70,320 | $12,640 | $57,680 |
| 2022 | $2,399 | $42,110 | $12,640 | $29,470 |
| 2021 | $1,298 | $42,110 | $12,640 | $29,470 |
| 2020 | $720 | $17,540 | $10,330 | $7,210 |
| 2019 | $721 | $13,940 | $10,330 | $3,610 |
| 2018 | $599 | $13,940 | $10,330 | $3,610 |
| 2017 | $220 | $3,890 | $3,890 | $0 |
| 2016 | $159 | $3,890 | $3,890 | $0 |
| 2015 | $152 | $3,890 | $3,890 | $0 |
| 2014 | $447 | $3,890 | $3,890 | $0 |
| 2013 | -- | $3,890 | $3,890 | $0 |
Source: Public Records
Map
Nearby Homes
- 12 Road
- 219 Illinois Dr
- 206 Brown Dr
- 109 Scott Dr
- 0 Saint Andrews Dr
- 00 Troon Ct
- 4441 Ohio 576
- 6695 Ohio 15
- 202 Belfast Ln
- 322 Dublin Ln
- 324 Dublin Ln
- 7825 County Road 7g
- 10258 County Road D
- 9626 State Route 249
- 101 Westview St
- 118 Townline Rd
- 107 Deerfield Cir
- 311 Connin St
- 319 Newdale Dr
- 8825 County Road D
- 0 Williams County G Unit 4580924
- 000 Williams County G
- 0 Williams County G Unit 5065459
- 11054 County Road G
- 10959 County Road G
- 6947 State Route 576
- 10936 County Road G
- 10899 County Road G
- 10899 County Road G
- 10884 County Road G
- 10869 County Road G
- 10797 County Road G
- 7348 State Route 576
- 10701 County Road G
- 11380 County Road G
- 7416 State Route 576
- 7416 State Route 576
- 7482 State Route 576
- 7482 Ohio 576
- 10604 County Road G