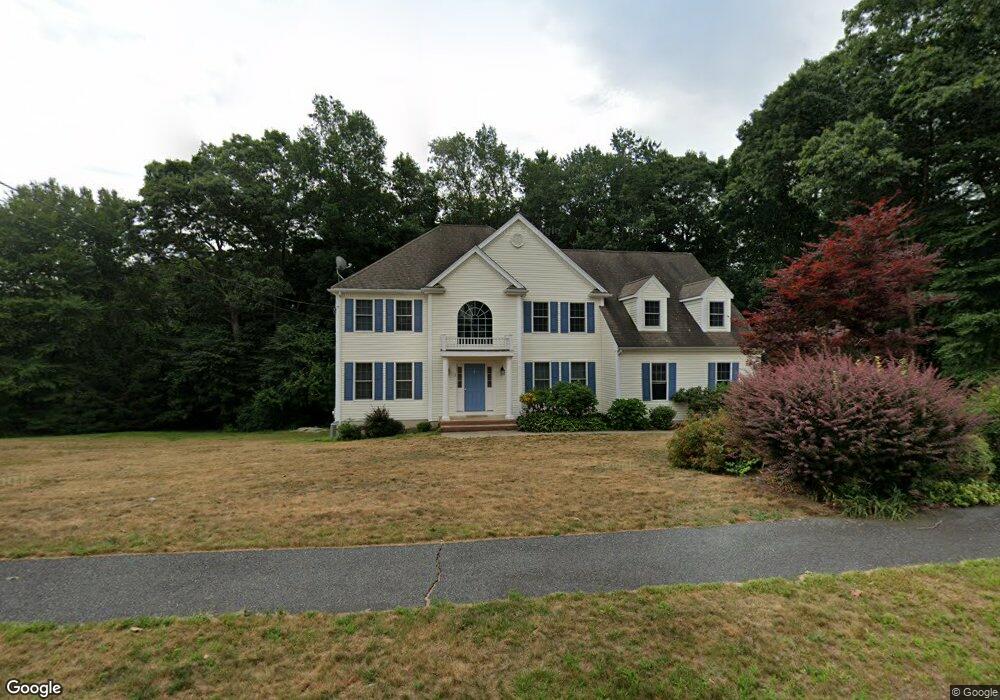
1 Brook Hollow Rd Unit 1 Milford, MA 01757
Estimated Value: $859,000 - $991,000
4
Beds
3
Baths
2,807
Sq Ft
$326/Sq Ft
Est. Value
About This Home
This home is located at 1 Brook Hollow Rd Unit 1, Milford, MA 01757 and is currently estimated at $913,744, approximately $325 per square foot. 1 Brook Hollow Rd Unit 1 is a home located in Worcester County with nearby schools including Milford High School.
Ownership History
Date
Name
Owned For
Owner Type
Purchase Details
Closed on
Oct 30, 2003
Sold by
Andreola A Paul
Bought by
Que John U and Que Judy A
Current Estimated Value
Home Financials for this Owner
Home Financials are based on the most recent Mortgage that was taken out on this home.
Original Mortgage
$200,000
Outstanding Balance
$93,043
Interest Rate
6.05%
Mortgage Type
Purchase Money Mortgage
Estimated Equity
$820,701
Create a Home Valuation Report for This Property
The Home Valuation Report is an in-depth analysis detailing your home's value as well as a comparison with similar homes in the area
Home Values in the Area
Average Home Value in this Area
Purchase History
| Date | Buyer | Sale Price | Title Company |
|---|---|---|---|
| Que John U | $519,900 | -- |
Source: Public Records
Mortgage History
| Date | Status | Borrower | Loan Amount |
|---|---|---|---|
| Open | Que John U | $200,000 |
Source: Public Records
Tax History Compared to Growth
Tax History
| Year | Tax Paid | Tax Assessment Tax Assessment Total Assessment is a certain percentage of the fair market value that is determined by local assessors to be the total taxable value of land and additions on the property. | Land | Improvement |
|---|---|---|---|---|
| 2025 | $10,884 | $850,300 | $227,400 | $622,900 |
| 2024 | $10,762 | $809,800 | $218,700 | $591,100 |
| 2023 | $10,049 | $695,400 | $181,700 | $513,700 |
| 2022 | $9,476 | $615,700 | $166,400 | $449,300 |
| 2021 | $8,989 | $562,500 | $166,400 | $396,100 |
| 2020 | $8,867 | $555,600 | $166,400 | $389,200 |
| 2019 | $8,751 | $529,100 | $166,400 | $362,700 |
| 2018 | $8,745 | $528,100 | $168,600 | $359,500 |
| 2017 | $8,393 | $499,900 | $168,600 | $331,300 |
| 2016 | $8,205 | $477,600 | $168,600 | $309,000 |
| 2015 | $7,350 | $418,800 | $168,600 | $250,200 |
Source: Public Records
Map
Nearby Homes