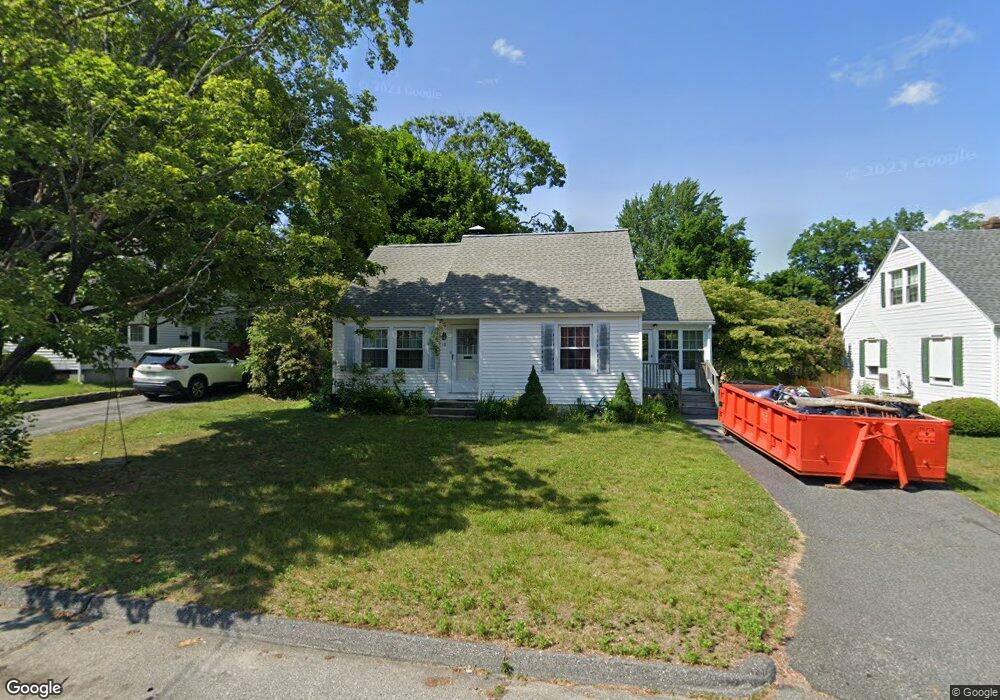
10 Benjamin Rd Worcester, MA 01602
West Tatnuck NeighborhoodEstimated Value: $390,000 - $442,000
3
Beds
2
Baths
1,122
Sq Ft
$366/Sq Ft
Est. Value
About This Home
This home is located at 10 Benjamin Rd, Worcester, MA 01602 and is currently estimated at $410,304, approximately $365 per square foot. 10 Benjamin Rd is a home located in Worcester County with nearby schools including West Tatnuck School, Chandler Magnet, and Jacob Hiatt Magnet School.
Ownership History
Date
Name
Owned For
Owner Type
Purchase Details
Closed on
Oct 15, 2019
Sold by
Hayes Robert F and Healy-Hayes Mona
Bought by
Garcidiaz Joshua A and Garcidiaz Jamie T
Current Estimated Value
Home Financials for this Owner
Home Financials are based on the most recent Mortgage that was taken out on this home.
Original Mortgage
$220,000
Outstanding Balance
$191,021
Interest Rate
3.5%
Mortgage Type
New Conventional
Estimated Equity
$219,283
Purchase Details
Closed on
Dec 28, 2007
Sold by
Hayes Dorothy I
Bought by
Hayes Robert F
Home Financials for this Owner
Home Financials are based on the most recent Mortgage that was taken out on this home.
Original Mortgage
$120,000
Interest Rate
6.27%
Mortgage Type
Purchase Money Mortgage
Purchase Details
Closed on
Oct 11, 2006
Sold by
Jones Kristina L and Jones Michael K
Bought by
Jones Kristina L and Jones Michael K
Create a Home Valuation Report for This Property
The Home Valuation Report is an in-depth analysis detailing your home's value as well as a comparison with similar homes in the area
Home Values in the Area
Average Home Value in this Area
Purchase History
| Date | Buyer | Sale Price | Title Company |
|---|---|---|---|
| Garcidiaz Joshua A | $250,000 | -- | |
| Hayes Robert F | $150,000 | -- | |
| Jones Kristina L | -- | -- |
Source: Public Records
Mortgage History
| Date | Status | Borrower | Loan Amount |
|---|---|---|---|
| Open | Garcidiaz Joshua A | $220,000 | |
| Previous Owner | Hayes Robert F | $120,000 |
Source: Public Records
Tax History
| Year | Tax Paid | Tax Assessment Tax Assessment Total Assessment is a certain percentage of the fair market value that is determined by local assessors to be the total taxable value of land and additions on the property. | Land | Improvement |
|---|---|---|---|---|
| 2025 | $4,333 | $328,500 | $107,900 | $220,600 |
| 2024 | $4,254 | $309,400 | $107,900 | $201,500 |
| 2023 | $4,073 | $284,000 | $93,800 | $190,200 |
| 2022 | $3,728 | $245,100 | $75,100 | $170,000 |
| 2021 | $3,530 | $216,800 | $60,100 | $156,700 |
| 2020 | $3,007 | $176,900 | $60,100 | $116,800 |
| 2019 | $2,858 | $158,800 | $54,000 | $104,800 |
| 2018 | $2,878 | $152,200 | $54,000 | $98,200 |
| 2017 | $2,772 | $144,200 | $54,000 | $90,200 |
| 2016 | $2,702 | $131,100 | $40,900 | $90,200 |
| 2015 | $2,631 | $131,100 | $40,900 | $90,200 |
| 2014 | $2,562 | $131,100 | $40,900 | $90,200 |
Source: Public Records
Map
Nearby Homes
- 9 Newburn Rd
- 23 Tiverton Pkwy
- 21 Baxter St
- 122 Copperfield Rd
- 118 Beaconsfield Rd
- 12 Cardinal Rd
- 148A Tory Fort Ln
- 20 Wedgewood Rd
- 18 Merlin Ct Unit 18
- 47R Yarnie Unit 3A
- 47R Yarnie Unit 1B
- 47R Yarnie Unit 2B
- 47R Yarnie Unit 4B
- 47R Yarnie Unit 8B
- 47R Yarnie Unit 5A
- 47R Yarnie Unit 6B
- 47R Yarnie Unit 4A
- 47R Yarnie Unit 1A
- 47R Yarnie Unit 9
- 47R Yarnie Unit 8A
Your Personal Tour Guide
Ask me questions while you tour the home.