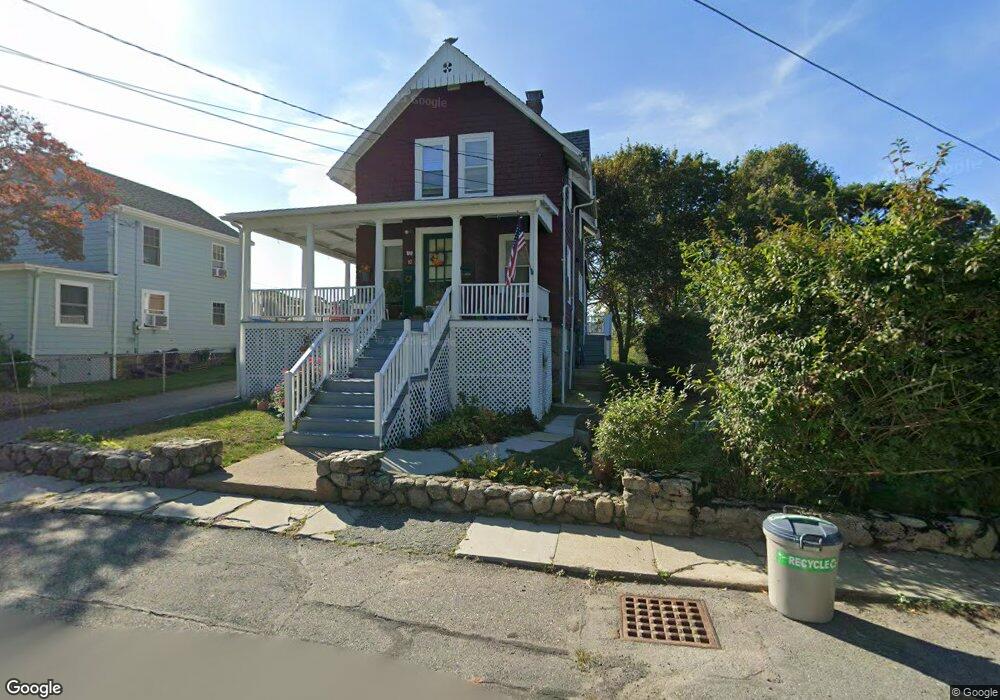
10 Blake Ct Gloucester, MA 01930
East Gloucester NeighborhoodEstimated Value: $643,780 - $852,000
3
Beds
2
Baths
1,224
Sq Ft
$613/Sq Ft
Est. Value
About This Home
This home is located at 10 Blake Ct, Gloucester, MA 01930 and is currently estimated at $749,945, approximately $612 per square foot. 10 Blake Ct is a home located in Essex County with nearby schools including East Gloucester Elementary School, Ralph B O'maley Middle School, and Gloucester High School.
Ownership History
Date
Name
Owned For
Owner Type
Purchase Details
Closed on
May 29, 2025
Sold by
Willette Rt and Willette
Bought by
Willette Ft and Aspesi
Current Estimated Value
Purchase Details
Closed on
Aug 1, 2003
Sold by
Fugarino Gloria and Fugarino John
Bought by
Willette John F and Willette Geraldine M
Home Financials for this Owner
Home Financials are based on the most recent Mortgage that was taken out on this home.
Original Mortgage
$283,200
Interest Rate
5.28%
Mortgage Type
Purchase Money Mortgage
Purchase Details
Closed on
Nov 22, 1996
Sold by
Burke Raymond E Est
Bought by
Fugarino Gloria J and Fugarino John
Purchase Details
Closed on
Mar 4, 1994
Sold by
Burke Raymond E
Bought by
Meuse Stanley and Meuse Elizabeth
Create a Home Valuation Report for This Property
The Home Valuation Report is an in-depth analysis detailing your home's value as well as a comparison with similar homes in the area
Home Values in the Area
Average Home Value in this Area
Purchase History
| Date | Buyer | Sale Price | Title Company |
|---|---|---|---|
| Willette Ft | -- | None Available | |
| Willette Ft | -- | None Available | |
| Willette Ft | -- | None Available | |
| Willette John F | $354,000 | -- | |
| Willette John F | $354,000 | -- | |
| Fugarino Gloria J | $122,000 | -- | |
| Fugarino Gloria J | $122,000 | -- | |
| Meuse Stanley | $1,000 | -- | |
| Meuse Stanley | $1,000 | -- |
Source: Public Records
Mortgage History
| Date | Status | Borrower | Loan Amount |
|---|---|---|---|
| Previous Owner | Meuse Stanley | $100,000 | |
| Previous Owner | Meuse Stanley | $283,200 |
Source: Public Records
Tax History
| Year | Tax Paid | Tax Assessment Tax Assessment Total Assessment is a certain percentage of the fair market value that is determined by local assessors to be the total taxable value of land and additions on the property. | Land | Improvement |
|---|---|---|---|---|
| 2025 | $5,630 | $579,200 | $214,700 | $364,500 |
| 2024 | $5,536 | $569,000 | $204,500 | $364,500 |
| 2023 | $5,314 | $501,800 | $182,600 | $319,200 |
| 2022 | $5,315 | $453,100 | $155,200 | $297,900 |
| 2021 | $5,135 | $412,800 | $141,100 | $271,700 |
| 2020 | $5,021 | $407,200 | $141,100 | $266,100 |
| 2019 | $4,765 | $375,500 | $141,100 | $234,400 |
| 2018 | $4,562 | $352,800 | $141,100 | $211,700 |
| 2017 | $4,425 | $335,500 | $134,400 | $201,100 |
| 2016 | $4,254 | $312,600 | $134,900 | $177,700 |
| 2015 | $4,088 | $299,500 | $134,900 | $164,600 |
Source: Public Records
Map
Nearby Homes
- 3 Mondello Square
- 70 Bass Ave
- 5 Wise Place
- 36 Eastern Ave
- 197 E Main St Unit 1
- 139A Prospect St
- 26 Marina Dr
- 60 Rocky Neck Ave Unit 202
- 73 Rocky Neck Ave Unit 2
- 191 Main St Unit 3
- 191 Main St Unit 2A
- 19 Trask St Unit 2
- 50 Warner St
- 1 Wonson St
- 113 Pleasant St
- 70 Old Nugent Farm Rd
- 10 Seaview Rd
- 40 Sargent St
- 33 Maplewood Ave Unit 310
- 35 Middle St Unit 4
Your Personal Tour Guide
Ask me questions while you tour the home.