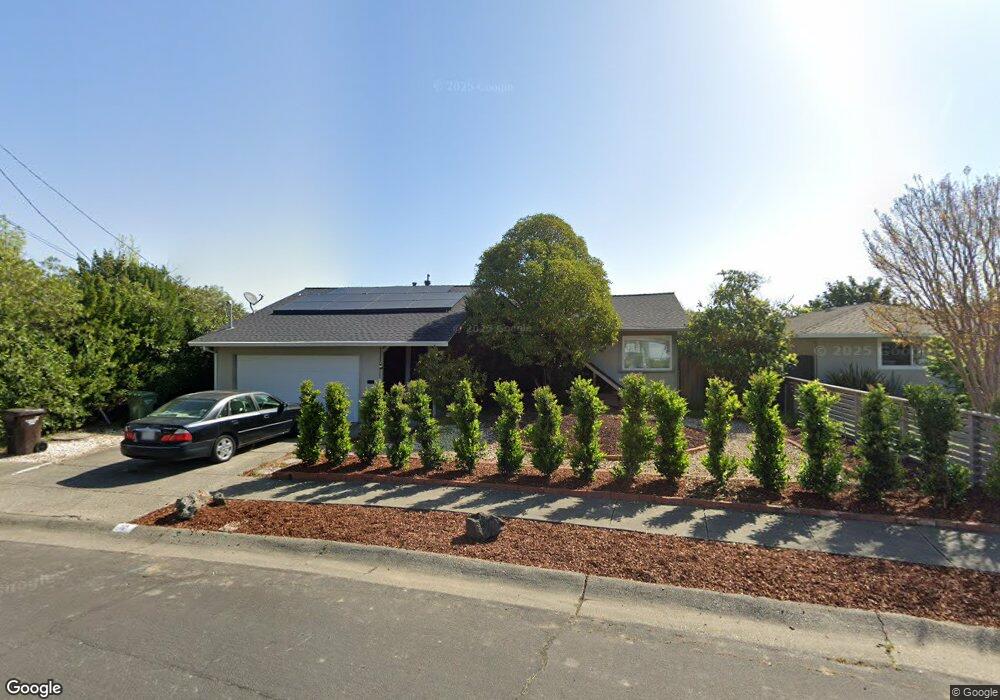
10 Cheyenne Way Corte Madera, CA 94925
Estimated Value: $1,341,000 - $1,838,000
3
Beds
2
Baths
1,365
Sq Ft
$1,188/Sq Ft
Est. Value
About This Home
This home is located at 10 Cheyenne Way, Corte Madera, CA 94925 and is currently estimated at $1,621,344, approximately $1,187 per square foot. 10 Cheyenne Way is a home located in Marin County with nearby schools including Neil Cummins Elementary School, The Cove School, and Hall Middle School.
Ownership History
Date
Name
Owned For
Owner Type
Purchase Details
Closed on
Nov 3, 2009
Sold by
Oneill Wm
Bought by
Oneill Wm
Current Estimated Value
Home Financials for this Owner
Home Financials are based on the most recent Mortgage that was taken out on this home.
Original Mortgage
$938,250
Outstanding Balance
$610,443
Interest Rate
4.93%
Mortgage Type
Reverse Mortgage Home Equity Conversion Mortgage
Estimated Equity
$1,010,901
Purchase Details
Closed on
Jul 28, 2003
Sold by
Oneill William R
Bought by
The W Oneill Revocable Living Trust
Purchase Details
Closed on
Apr 9, 1998
Sold by
Vitale Elise C
Bought by
Oneill William R
Home Financials for this Owner
Home Financials are based on the most recent Mortgage that was taken out on this home.
Original Mortgage
$178,000
Interest Rate
7.18%
Create a Home Valuation Report for This Property
The Home Valuation Report is an in-depth analysis detailing your home's value as well as a comparison with similar homes in the area
Home Values in the Area
Average Home Value in this Area
Purchase History
| Date | Buyer | Sale Price | Title Company |
|---|---|---|---|
| Oneill Wm | -- | Placer Title Company | |
| The W Oneill Revocable Living Trust | -- | -- | |
| Oneill William R | $89,000 | Pacific Coast Title Company |
Source: Public Records
Mortgage History
| Date | Status | Borrower | Loan Amount |
|---|---|---|---|
| Open | Oneill Wm | $938,250 | |
| Closed | Oneill William R | $178,000 |
Source: Public Records
Tax History
| Year | Tax Paid | Tax Assessment Tax Assessment Total Assessment is a certain percentage of the fair market value that is determined by local assessors to be the total taxable value of land and additions on the property. | Land | Improvement |
|---|---|---|---|---|
| 2025 | $4,294 | $254,563 | $87,200 | $167,363 |
| 2024 | $3,979 | $249,572 | $85,491 | $164,081 |
| 2023 | $3,687 | $244,679 | $83,814 | $160,865 |
| 2022 | $3,662 | $239,882 | $82,171 | $157,711 |
| 2021 | $1,807 | $235,179 | $80,560 | $154,619 |
| 2020 | $3,619 | $232,769 | $79,735 | $153,034 |
| 2019 | $3,387 | $228,205 | $78,171 | $150,034 |
| 2018 | $3,382 | $223,731 | $76,639 | $147,092 |
| 2017 | $3,437 | $219,344 | $75,136 | $144,208 |
| 2016 | $3,316 | $215,044 | $73,663 | $141,381 |
| 2015 | $3,327 | $211,815 | $72,557 | $139,258 |
| 2014 | $3,191 | $207,666 | $71,136 | $136,530 |
Source: Public Records
Map
Nearby Homes
- 34 Diane Ln
- 61 Pixley Ave Unit 2
- 66 Rose Ln
- 15 Orchid Dr
- 35 Palm Ave
- 15 Camellia Cir
- 2000 Redwood Hwy
- 614 Tamalpais Dr
- 104 Baltimore Ave
- 263 Camellia Cir
- 93 Magnolia Ave
- 317 Redwood Ave
- 2130 Redwood Hwy Unit F5
- 2130 Redwood Hwy Unit G6
- 11 Gretchen Place
- 24 Boardwalk One
- 21 Boardwalk One
- 34 Boardwalk One
- 408 Larkspur Plaza Dr
- 141 Edison Ave
- 6 Cheyenne Way
- 14 Cheyenne Way
- 4 Cheyenne Way
- 113 Lakeside Dr
- 13 Cheyenne Way
- 9 Cheyenne Way
- 2 Cheyenne Way
- 109 Lakeside Dr
- 5 Cheyenne Way
- 130 Birch Ave
- 112 Lakeside Dr
- 125 Lakeside Dr
- 108 Lakeside Dr
- 116 Lakeside Dr
- 126 Birch Ave
- 1 Cheyenne Way
- 105 Lakeside Dr
- 120 Lakeside Dr
- 104 Lakeside Dr
- 152 Birch Ave
Your Personal Tour Guide
Ask me questions while you tour the home.