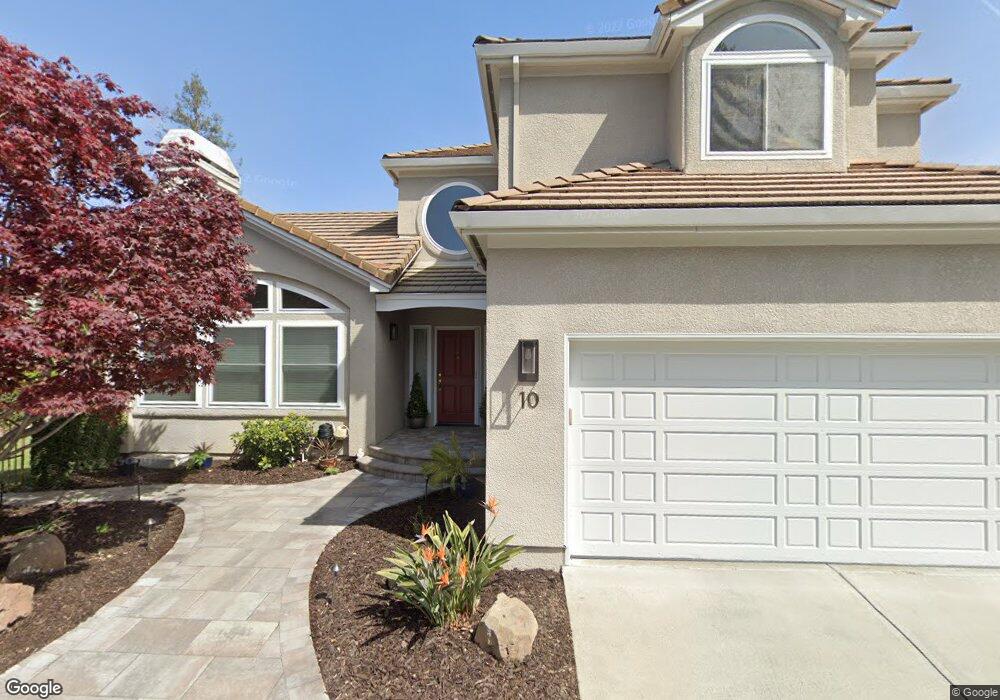
10 Dunne Ct Menlo Park, CA 94025
North Fair Oaks NeighborhoodEstimated Value: $2,637,000 - $3,214,000
4
Beds
3
Baths
2,670
Sq Ft
$1,076/Sq Ft
Est. Value
About This Home
This home is located at 10 Dunne Ct, Menlo Park, CA 94025 and is currently estimated at $2,872,069, approximately $1,075 per square foot. 10 Dunne Ct is a home located in San Mateo County with nearby schools including Garfield Elementary School, John F. Kennedy Middle School, and Menlo-Atherton High School.
Ownership History
Date
Name
Owned For
Owner Type
Purchase Details
Closed on
Mar 16, 2017
Sold by
Hinson James and Hinson Mary P
Bought by
Hinson James D and Hinson Mary P
Current Estimated Value
Purchase Details
Closed on
Jun 25, 2010
Sold by
Hinson James and Hinson Mary P
Bought by
Hinson James and Hinson Mary P
Home Financials for this Owner
Home Financials are based on the most recent Mortgage that was taken out on this home.
Original Mortgage
$112,000
Outstanding Balance
$91,227
Interest Rate
4.79%
Mortgage Type
Future Advance Clause Open End Mortgage
Estimated Equity
$2,780,842
Purchase Details
Closed on
Dec 6, 2002
Sold by
Dennery Phyllis A and Mundy Gregory L
Bought by
Hinson James and Hinson Mary
Home Financials for this Owner
Home Financials are based on the most recent Mortgage that was taken out on this home.
Original Mortgage
$740,000
Interest Rate
5.62%
Create a Home Valuation Report for This Property
The Home Valuation Report is an in-depth analysis detailing your home's value as well as a comparison with similar homes in the area
Home Values in the Area
Average Home Value in this Area
Purchase History
We collect this data history from publicly available records. To have your information removed, we recommend requesting removal directly through your county’s website.
| Date | Buyer | Sale Price | Title Company |
|---|---|---|---|
| Hinson James D | -- | None Available | |
| Hinson James | -- | Old Republic Title Company | |
| Hinson James | $925,000 | First American Title Company |
Source: Public Records
Mortgage History
We collect this data history from publicly available records. To have your information removed, we recommend requesting removal directly through your county’s website.
| Date | Status | Borrower | Loan Amount |
|---|---|---|---|
| Open | Hinson James | $112,000 | |
| Open | Hinson James | $668,000 | |
| Closed | Hinson James | $740,000 |
Source: Public Records
Tax History
| Year | Tax Paid | Tax Assessment Tax Assessment Total Assessment is a certain percentage of the fair market value that is determined by local assessors to be the total taxable value of land and additions on the property. | Land | Improvement |
|---|---|---|---|---|
| 2025 | $16,206 | $1,339,690 | $669,845 | $669,845 |
| 2023 | $16,206 | $1,287,670 | $643,835 | $643,835 |
| 2022 | $15,164 | $1,262,422 | $631,211 | $631,211 |
| 2021 | $15,001 | $1,237,670 | $618,835 | $618,835 |
| 2020 | $14,789 | $1,224,980 | $612,490 | $612,490 |
| 2019 | $14,678 | $1,200,962 | $600,481 | $600,481 |
| 2018 | $14,224 | $1,177,414 | $588,707 | $588,707 |
| 2017 | $13,895 | $1,154,328 | $577,164 | $577,164 |
| 2016 | $13,613 | $1,131,696 | $565,848 | $565,848 |
| 2015 | $13,101 | $1,114,698 | $557,349 | $557,349 |
| 2014 | $12,838 | $1,092,864 | $546,432 | $546,432 |
Source: Public Records
Map
Nearby Homes
Your Personal Tour Guide
Ask me questions while you tour the home.