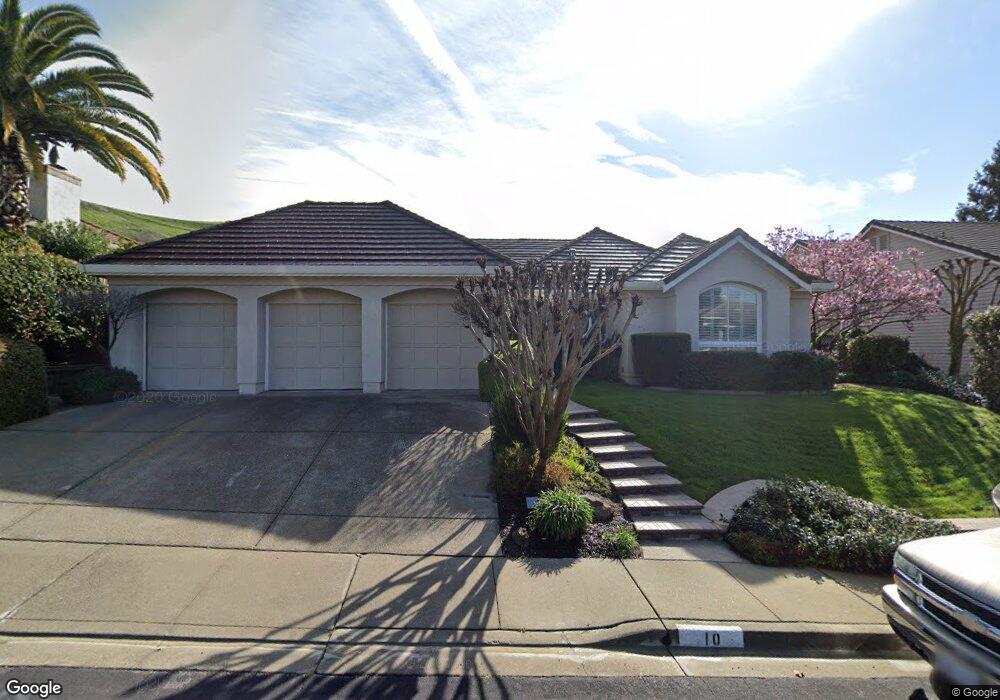
10 Edinburgh Place Danville, CA 94526
Estimated Value: $2,096,464 - $2,282,000
4
Beds
3
Baths
3,020
Sq Ft
$724/Sq Ft
Est. Value
About This Home
This home is located at 10 Edinburgh Place, Danville, CA 94526 and is currently estimated at $2,186,866, approximately $724 per square foot. 10 Edinburgh Place is a home located in Contra Costa County with nearby schools including John Baldwin Elementary School, Charlotte Wood Middle School, and San Ramon Valley High School.
Ownership History
Date
Name
Owned For
Owner Type
Purchase Details
Closed on
Feb 21, 2012
Sold by
Verdina Robert J and Verdina Monica J
Bought by
Verdina Robert J and Verdina Monica J
Current Estimated Value
Home Financials for this Owner
Home Financials are based on the most recent Mortgage that was taken out on this home.
Original Mortgage
$385,600
Outstanding Balance
$263,542
Interest Rate
3.84%
Mortgage Type
New Conventional
Estimated Equity
$1,923,324
Purchase Details
Closed on
Sep 22, 2005
Sold by
Verdina Robert J and Verdina Monica J
Bought by
Verdina Robert J and Verdina Monica J
Purchase Details
Closed on
Nov 22, 1994
Sold by
Shapell Industries Inc
Bought by
Verdina Robert J and Verdina Monica J
Home Financials for this Owner
Home Financials are based on the most recent Mortgage that was taken out on this home.
Original Mortgage
$325,000
Interest Rate
8.9%
Mortgage Type
Purchase Money Mortgage
Create a Home Valuation Report for This Property
The Home Valuation Report is an in-depth analysis detailing your home's value as well as a comparison with similar homes in the area
Home Values in the Area
Average Home Value in this Area
Purchase History
| Date | Buyer | Sale Price | Title Company |
|---|---|---|---|
| Verdina Robert J | -- | North American Title Company | |
| Verdina Robert J | -- | North American Title Company | |
| Verdina Robert J | -- | -- | |
| Verdina Robert J | $512,000 | Financial Title Company |
Source: Public Records
Mortgage History
| Date | Status | Borrower | Loan Amount |
|---|---|---|---|
| Open | Verdina Robert J | $385,600 | |
| Closed | Verdina Robert J | $325,000 |
Source: Public Records
Tax History Compared to Growth
Tax History
| Year | Tax Paid | Tax Assessment Tax Assessment Total Assessment is a certain percentage of the fair market value that is determined by local assessors to be the total taxable value of land and additions on the property. | Land | Improvement |
|---|---|---|---|---|
| 2025 | $10,294 | $874,767 | $382,959 | $491,808 |
| 2024 | $10,131 | $857,615 | $375,450 | $482,165 |
| 2023 | $10,131 | $840,800 | $368,089 | $472,711 |
| 2022 | $10,056 | $824,315 | $360,872 | $463,443 |
| 2021 | $9,839 | $808,153 | $353,797 | $454,356 |
| 2019 | $9,627 | $784,185 | $343,304 | $440,881 |
| 2018 | $9,272 | $768,810 | $336,573 | $432,237 |
| 2017 | $9,079 | $753,736 | $329,974 | $423,762 |
| 2016 | $8,964 | $738,957 | $323,504 | $415,453 |
| 2015 | $8,849 | $727,858 | $318,645 | $409,213 |
| 2014 | $8,729 | $713,602 | $312,404 | $401,198 |
Source: Public Records
Map
Nearby Homes
- 40 Edinburgh Place
- 651 Derbyshire Place
- 10 Glasgow Cir
- 24 Volterra Ct
- 74 Estonian Ct
- 732 Graham Ct
- 5 Stuart Place
- 275 Gil Blas Rd
- 211 Arthur Ct
- 33 Leeds Ct E
- 61 Ambleside Ct
- 66 Ambleside Ct
- 144 Tweed Dr
- 10 Gold Poppy Ct
- 100 Tobiano Ct
- 21 Charolais Ct
- 491 Scotts Mill Rd
- 35 Danube Ct
- 336 Merrilee Place
- 1826 Alameda Diablo
- 210 Edinburgh Cir
- 20 Edinburgh Place
- 5 Edinburgh Place
- 200 Edinburgh Cir
- 30 Edinburgh Place
- 195 Edinburgh Cir
- 15 Edinburgh Place
- 190 Edinburgh Cir
- 220 Edinburgh Cir
- 25 Edinburgh Place
- 205 Edinburgh Cir
- 185 Edinburgh Cir
- 35 Edinburgh Place
- 45 Edinburgh Place
- 230 Edinburgh Cir
- 180 Edinburgh Cir
- 215 Edinburgh Cir
- 175 Edinburgh Cir
- 170 Edinburgh Cir
- 240 Edinburgh Cir