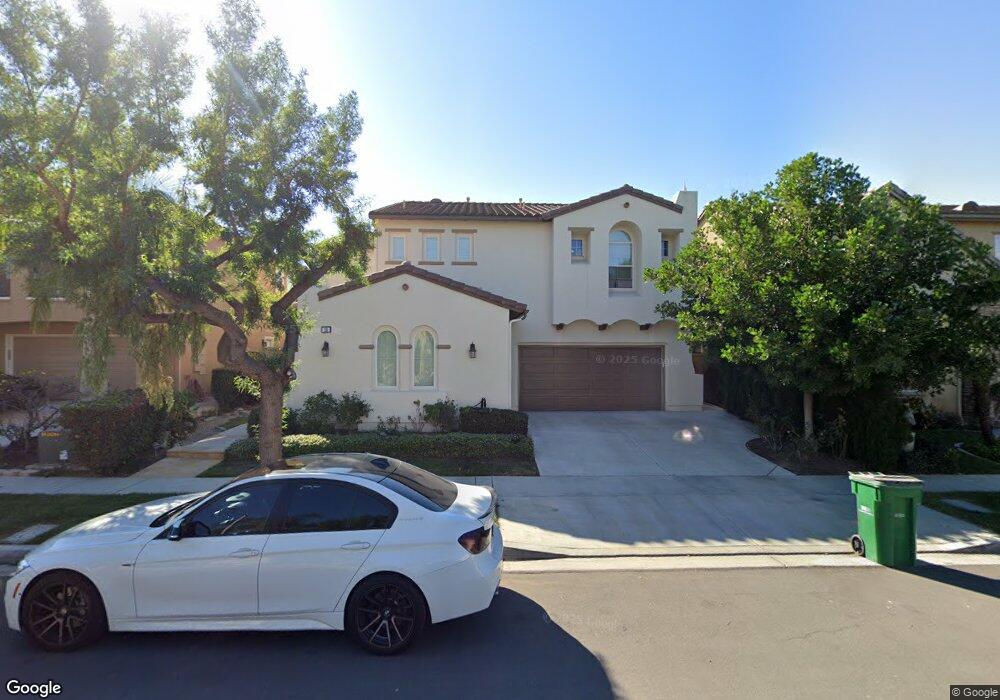
10 Grapevine Irvine, CA 92602
Lower Peters Canyon NeighborhoodEstimated Value: $2,359,032 - $2,817,000
5
Beds
3
Baths
3,456
Sq Ft
$753/Sq Ft
Est. Value
About This Home
This home is located at 10 Grapevine, Irvine, CA 92602 and is currently estimated at $2,602,758, approximately $753 per square foot. 10 Grapevine is a home located in Orange County with nearby schools including Hicks Canyon Elementary School, Orchard Hills School, and Arnold O. Beckman High School.
Ownership History
Date
Name
Owned For
Owner Type
Purchase Details
Closed on
Jul 21, 2023
Sold by
Chuang Yalan and Chuang Chin Lien
Bought by
Chuang Yalan and Chuang Chin Lien
Current Estimated Value
Purchase Details
Closed on
Sep 27, 2002
Sold by
Lennar Homes Of California Inc
Bought by
Chuang Yalan and Chuang Chin Lien
Home Financials for this Owner
Home Financials are based on the most recent Mortgage that was taken out on this home.
Original Mortgage
$300,700
Interest Rate
5.89%
Create a Home Valuation Report for This Property
The Home Valuation Report is an in-depth analysis detailing your home's value as well as a comparison with similar homes in the area
Home Values in the Area
Average Home Value in this Area
Purchase History
| Date | Buyer | Sale Price | Title Company |
|---|---|---|---|
| Chuang Yalan | -- | Accommodation/Courtesy Recordi | |
| Chuang Yalan | $649,000 | -- |
Source: Public Records
Mortgage History
| Date | Status | Borrower | Loan Amount |
|---|---|---|---|
| Previous Owner | Chuang Yalan | $300,700 |
Source: Public Records
Tax History
| Year | Tax Paid | Tax Assessment Tax Assessment Total Assessment is a certain percentage of the fair market value that is determined by local assessors to be the total taxable value of land and additions on the property. | Land | Improvement |
|---|---|---|---|---|
| 2025 | $11,150 | $954,078 | $423,589 | $530,489 |
| 2024 | $11,150 | $935,371 | $415,283 | $520,088 |
| 2023 | $10,974 | $917,031 | $407,140 | $509,891 |
| 2022 | $10,766 | $899,050 | $399,156 | $499,894 |
| 2021 | $12,355 | $881,422 | $391,329 | $490,093 |
| 2020 | $12,261 | $872,385 | $387,317 | $485,068 |
| 2019 | $12,006 | $855,280 | $379,723 | $475,557 |
| 2018 | $11,781 | $838,510 | $372,277 | $466,233 |
| 2017 | $11,524 | $822,069 | $364,977 | $457,092 |
| 2016 | $11,334 | $805,950 | $357,820 | $448,130 |
| 2015 | $11,217 | $793,844 | $352,445 | $441,399 |
| 2014 | $11,052 | $778,294 | $345,541 | $432,753 |
Source: Public Records
Map
Nearby Homes
Your Personal Tour Guide
Ask me questions while you tour the home.