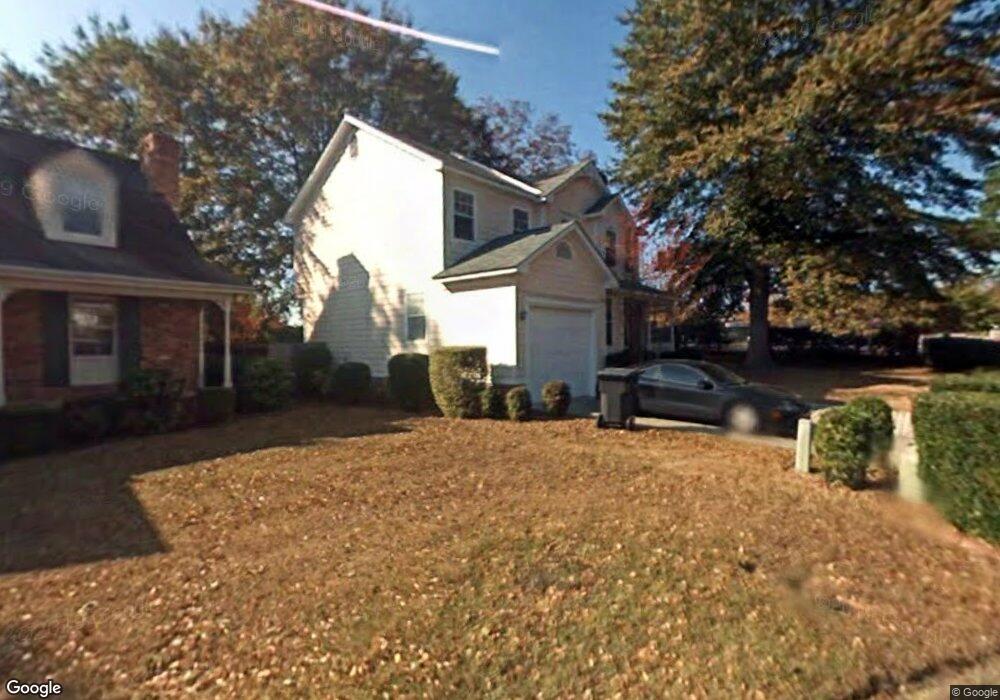
10 Mulberry Ln Augusta, GA 30909
West Augusta NeighborhoodEstimated Value: $267,000 - $299,000
4
Beds
3
Baths
1,768
Sq Ft
$160/Sq Ft
Est. Value
About This Home
This home is located at 10 Mulberry Ln, Augusta, GA 30909 and is currently estimated at $282,865, approximately $159 per square foot. 10 Mulberry Ln is a home located in Richmond County with nearby schools including First Coast Technical Institute, R.B. Hunt Elementary School, and A. Brian Merry Elementary School.
Ownership History
Date
Name
Owned For
Owner Type
Purchase Details
Closed on
Nov 8, 2001
Sold by
Family Mtg Service Corp #19
Bought by
Belk Lamont A
Current Estimated Value
Home Financials for this Owner
Home Financials are based on the most recent Mortgage that was taken out on this home.
Original Mortgage
$102,000
Outstanding Balance
$39,284
Interest Rate
6.67%
Estimated Equity
$243,581
Purchase Details
Closed on
May 2, 2000
Sold by
Eastern Svgs Bank
Bought by
Family Mtg Service Corp #19
Purchase Details
Closed on
Feb 8, 1995
Sold by
Crook Michael E Crook Constance
Bought by
Crook Constance Crook Lisa Lucero
Purchase Details
Closed on
Nov 30, 1994
Sold by
Crook Michael E
Bought by
Crook Lisa Lucero
Purchase Details
Closed on
Sep 26, 1994
Sold by
Crook Constance
Bought by
Crook Michael E
Purchase Details
Closed on
Nov 1, 1986
Sold by
Wilba Co The
Bought by
Crook Michael E
Create a Home Valuation Report for This Property
The Home Valuation Report is an in-depth analysis detailing your home's value as well as a comparison with similar homes in the area
Home Values in the Area
Average Home Value in this Area
Purchase History
| Date | Buyer | Sale Price | Title Company |
|---|---|---|---|
| Belk Lamont A | $102,000 | -- | |
| Family Mtg Service Corp #19 | -- | -- | |
| Eastern Svgs Bank | $90,000 | -- | |
| Crook Constance Crook Lisa Lucero | -- | -- | |
| Crook Lisa Lucero | -- | -- | |
| Crook Michael E | -- | -- | |
| Crook Michael E | $99,500 | -- |
Source: Public Records
Mortgage History
| Date | Status | Borrower | Loan Amount |
|---|---|---|---|
| Open | Belk Lamont A | $102,000 |
Source: Public Records
Tax History Compared to Growth
Tax History
| Year | Tax Paid | Tax Assessment Tax Assessment Total Assessment is a certain percentage of the fair market value that is determined by local assessors to be the total taxable value of land and additions on the property. | Land | Improvement |
|---|---|---|---|---|
| 2025 | $3,068 | $98,540 | $11,600 | $86,940 |
| 2024 | $3,068 | $97,316 | $11,600 | $85,716 |
| 2023 | $2,920 | $93,848 | $11,600 | $82,248 |
| 2022 | $2,276 | $70,176 | $11,600 | $58,576 |
| 2021 | $2,114 | $58,692 | $11,600 | $47,092 |
| 2020 | $2,080 | $58,692 | $11,600 | $47,092 |
| 2019 | $1,905 | $49,274 | $11,600 | $37,674 |
| 2018 | $1,918 | $49,274 | $11,600 | $37,674 |
| 2017 | $1,909 | $49,274 | $11,600 | $37,674 |
| 2016 | $1,909 | $49,219 | $11,600 | $37,619 |
| 2015 | $1,922 | $49,219 | $11,600 | $37,619 |
| 2014 | $1,924 | $49,219 | $11,600 | $37,619 |
Source: Public Records
Map
Nearby Homes
- 3103 Clay Hill Dr
- 3084 Westwood Rd
- 3082 Westwood Rd
- 3086 Westwood Rd
- 206 Warren Rd
- 2413 Woodbluff Ct
- 2703 Oakbluff Ct
- 210 Gardners Mill Rd
- 2695 York Dr
- 46 Charlestowne Dr
- 3129 Ramsgate Rd
- 2507 Pinebluff Ct
- 3144 Edinburgh Dr
- 3121 Ramsgate Rd
- 213 Kings Chapel Rd
- 3218 Ramsgate Rd
- 3129 Edinburgh Dr
- 3222 Ramsgate Rd
- 227 Simmons Ct
- 311 Gardners Mill Ct
- 12 Mulberry Ln
- 14 Mulberry Ln
- 13 Mulberry Ln
- 11 Mulberry Ln
- 37 Queens Ct
- 16 Mulberry Ln
- 15 Mulberry Ln
- 3114 Skinner Mill Cir
- 3104 Skinner Mill Rd
- 39 Queens Ct
- 32 Queens Ct
- 18 Mulberry Ln
- 34 Queens Ct
- 17 Mulberry Ln
- 38 Queens Ct
- 19 Mulberry Ln
- 36 Queens Ct
- 21 Mulberry Ln
- 20 Mulberry Ln
- 22 Mulberry Ln