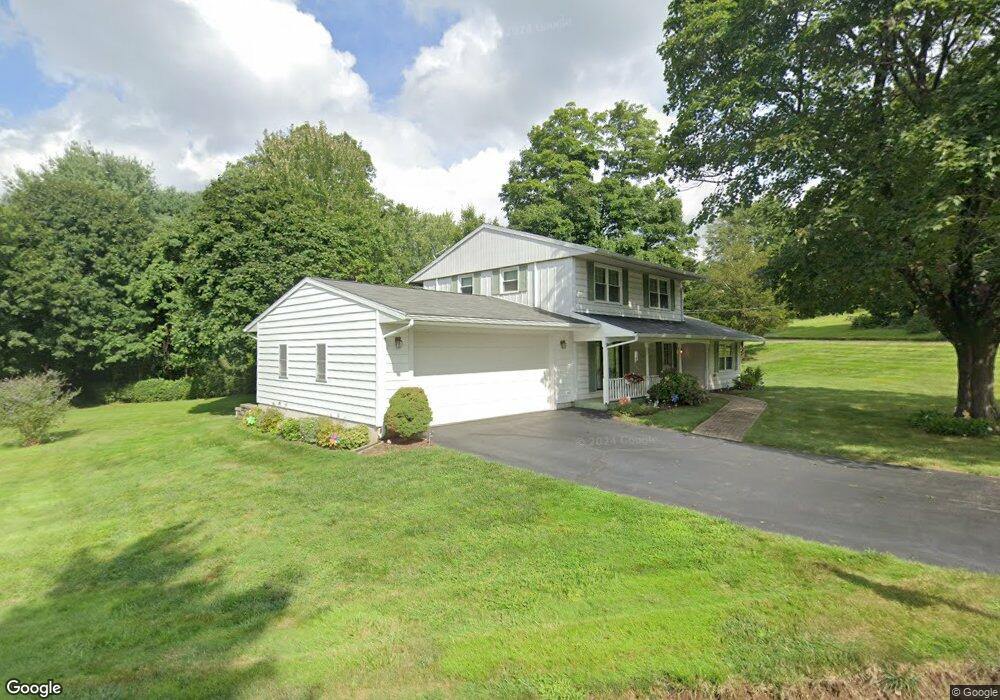
10 Red Cedar Ln Middletown, CT 06457
Westfield NeighborhoodEstimated Value: $380,988 - $441,000
3
Beds
2
Baths
1,873
Sq Ft
$216/Sq Ft
Est. Value
About This Home
This home is located at 10 Red Cedar Ln, Middletown, CT 06457 and is currently estimated at $404,497, approximately $215 per square foot. 10 Red Cedar Ln is a home located in Middlesex County with nearby schools including Moody School, Middletown High School, and St John Paul II School.
Ownership History
Date
Name
Owned For
Owner Type
Purchase Details
Closed on
Oct 25, 2006
Sold by
Pandisher Rose Marie E and Fox William J
Bought by
Nelson James
Current Estimated Value
Home Financials for this Owner
Home Financials are based on the most recent Mortgage that was taken out on this home.
Original Mortgage
$174,500
Interest Rate
6.48%
Create a Home Valuation Report for This Property
The Home Valuation Report is an in-depth analysis detailing your home's value as well as a comparison with similar homes in the area
Home Values in the Area
Average Home Value in this Area
Purchase History
| Date | Buyer | Sale Price | Title Company |
|---|---|---|---|
| Nelson James | $222,500 | -- |
Source: Public Records
Mortgage History
| Date | Status | Borrower | Loan Amount |
|---|---|---|---|
| Open | Nelson James | $171,500 | |
| Closed | Nelson James | $174,500 | |
| Previous Owner | Nelson James | $37,000 |
Source: Public Records
Tax History
| Year | Tax Paid | Tax Assessment Tax Assessment Total Assessment is a certain percentage of the fair market value that is determined by local assessors to be the total taxable value of land and additions on the property. | Land | Improvement |
|---|---|---|---|---|
| 2025 | $7,100 | $210,750 | $65,930 | $144,820 |
| 2024 | $6,731 | $210,750 | $65,930 | $144,820 |
| 2023 | $6,332 | $210,750 | $65,930 | $144,820 |
| 2022 | $5,718 | $152,400 | $43,960 | $108,440 |
| 2021 | $5,704 | $152,400 | $43,960 | $108,440 |
| 2020 | $5,712 | $152,400 | $43,960 | $108,440 |
| 2019 | $5,743 | $152,400 | $43,960 | $108,440 |
| 2018 | $5,394 | $148,410 | $43,960 | $104,450 |
| 2017 | $4,974 | $140,300 | $47,880 | $92,420 |
| 2016 | $4,877 | $140,300 | $47,880 | $92,420 |
| 2015 | $4,772 | $140,300 | $47,880 | $92,420 |
| 2014 | $4,774 | $140,300 | $47,880 | $92,420 |
Source: Public Records
Map
Nearby Homes
- 128 Webster Ln
- 153 Country Club Rd
- 137 Webster Ln Unit 2-42
- 145 Webster Ln Unit 2-41
- 60 Sonoma Ln
- 0 Country Club Rd and Massa Tom Rd Rd E
- 7 W Meadow Ln Unit 5
- 215 Carriage Crossing Ln Unit 215
- 118 Carriage Crossing Ln
- 133 Carriage Crossing Ln
- 44 Carriage Crossing Ln Unit 44
- 12 Carriage Crossing Ln Unit 12
- 318 Carriage Crossing Ln Unit 318
- 180 Carriage Crossing Ln Unit 180
- 159 Carriage Crossing Ln Unit 159
- 3 Braeburn Ln
- 270 Higby Rd
- 886 East St
- 0 Bell St Unit 24149149
- 473 Westfield St
Your Personal Tour Guide
Ask me questions while you tour the home.