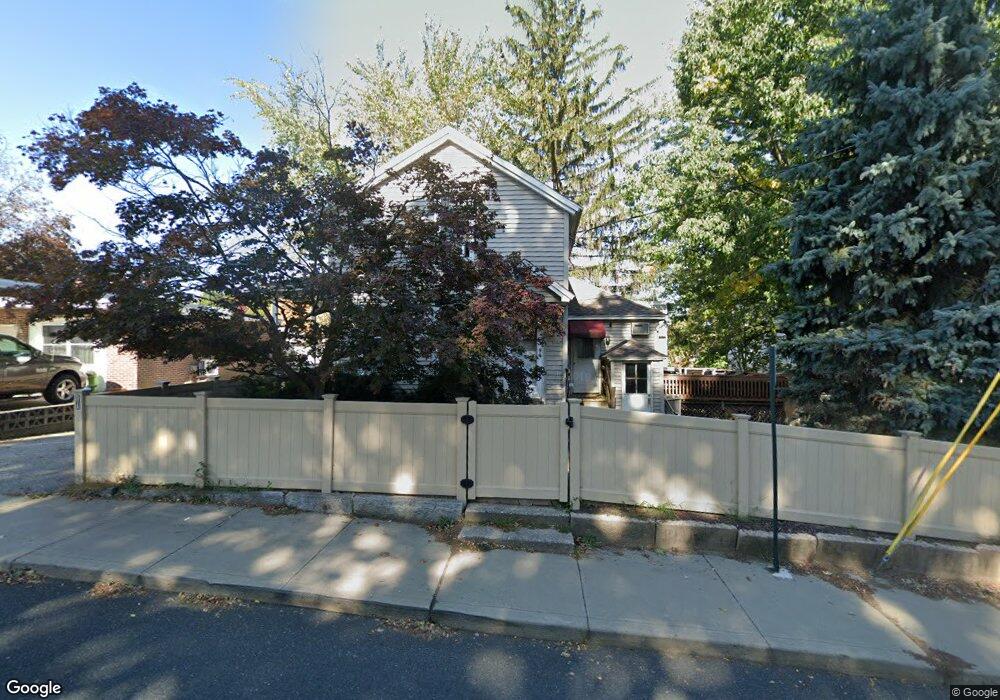
10 Rolf Ave Chicopee, MA 01020
Aldenville NeighborhoodEstimated Value: $292,000 - $373,000
3
Beds
2
Baths
1,629
Sq Ft
$194/Sq Ft
Est. Value
About This Home
This home is located at 10 Rolf Ave, Chicopee, MA 01020 and is currently estimated at $316,207, approximately $194 per square foot. 10 Rolf Ave is a home located in Hampden County with nearby schools including Lambert-Lavoie Elementary School, Fairview Middle School, and Chicopee Comprehensive High School.
Ownership History
Date
Name
Owned For
Owner Type
Purchase Details
Closed on
Mar 22, 2004
Sold by
Romano Ryan W
Bought by
Romano Giovanna and Romano Ryan W
Current Estimated Value
Home Financials for this Owner
Home Financials are based on the most recent Mortgage that was taken out on this home.
Original Mortgage
$131,000
Outstanding Balance
$61,395
Interest Rate
5.71%
Mortgage Type
Purchase Money Mortgage
Estimated Equity
$254,812
Purchase Details
Closed on
Aug 4, 1999
Sold by
Romano Michael J and Romano June C
Bought by
Romano Ryan
Home Financials for this Owner
Home Financials are based on the most recent Mortgage that was taken out on this home.
Original Mortgage
$109,100
Interest Rate
7.54%
Mortgage Type
Purchase Money Mortgage
Create a Home Valuation Report for This Property
The Home Valuation Report is an in-depth analysis detailing your home's value as well as a comparison with similar homes in the area
Home Values in the Area
Average Home Value in this Area
Purchase History
| Date | Buyer | Sale Price | Title Company |
|---|---|---|---|
| Romano Giovanna | -- | -- | |
| Romano Ryan | $107,000 | -- |
Source: Public Records
Mortgage History
| Date | Status | Borrower | Loan Amount |
|---|---|---|---|
| Open | Romano Giovanna | $131,000 | |
| Previous Owner | Romano Ryan | $112,600 | |
| Previous Owner | Romano Ryan | $109,100 | |
| Previous Owner | Romano Ryan | $86,000 |
Source: Public Records
Tax History
| Year | Tax Paid | Tax Assessment Tax Assessment Total Assessment is a certain percentage of the fair market value that is determined by local assessors to be the total taxable value of land and additions on the property. | Land | Improvement |
|---|---|---|---|---|
| 2025 | $3,929 | $259,200 | $91,000 | $168,200 |
| 2024 | $3,727 | $252,500 | $89,200 | $163,300 |
| 2023 | $3,497 | $230,800 | $81,100 | $149,700 |
| 2022 | $3,427 | $201,700 | $70,500 | $131,200 |
| 2021 | $3,244 | $184,200 | $64,100 | $120,100 |
| 2020 | $3,076 | $176,200 | $63,500 | $112,700 |
| 2019 | $3,032 | $168,800 | $63,500 | $105,300 |
| 2018 | $2,946 | $160,900 | $60,500 | $100,400 |
| 2017 | $2,910 | $168,100 | $59,100 | $109,000 |
| 2016 | $2,909 | $172,000 | $59,100 | $112,900 |
| 2015 | $2,771 | $158,000 | $59,100 | $98,900 |
| 2014 | $1,386 | $158,000 | $59,100 | $98,900 |
Source: Public Records
Map
Nearby Homes
- 11 Rolf Ave
- 331 Dale St
- 35 Silvin Rd
- 35 Mount Vernon Rd
- 583 Mckinstry Ave
- 56 Percy St
- 199 Meadow St
- 15 Cross St
- 541 Grattan St
- 88 Newell St
- 621 Chicopee St
- 1150 Granby Rd
- 1246 Granby Rd Unit 66
- 20 Mount Carmel Ave
- 200 Lambert Terrace Unit 46
- 171 State St
- 519 Chicopee St
- 124 Walter St
- 30 Catherine St
- 39 State St
- 16 Rolf Ave
- 20 Rolf Ave
- 854 Grattan St
- 13 Dartmouth St
- 21 Rolf Ave
- 23 Dartmouth St
- 23 Dartmouth St Unit 3
- 838 Grattan St
- 27 Dartmouth St
- 825 Grattan St
- 12 Dartmouth St
- 12 Crawford Ave
- 821 Grattan St
- 853 Grattan St
- 9 Baltic Ave
- 21 Baltic Ave
- 2 Crawford Ave
- 3 Crawford Ave
- 28 Crawford Ave
- 819 Grattan St
Your Personal Tour Guide
Ask me questions while you tour the home.