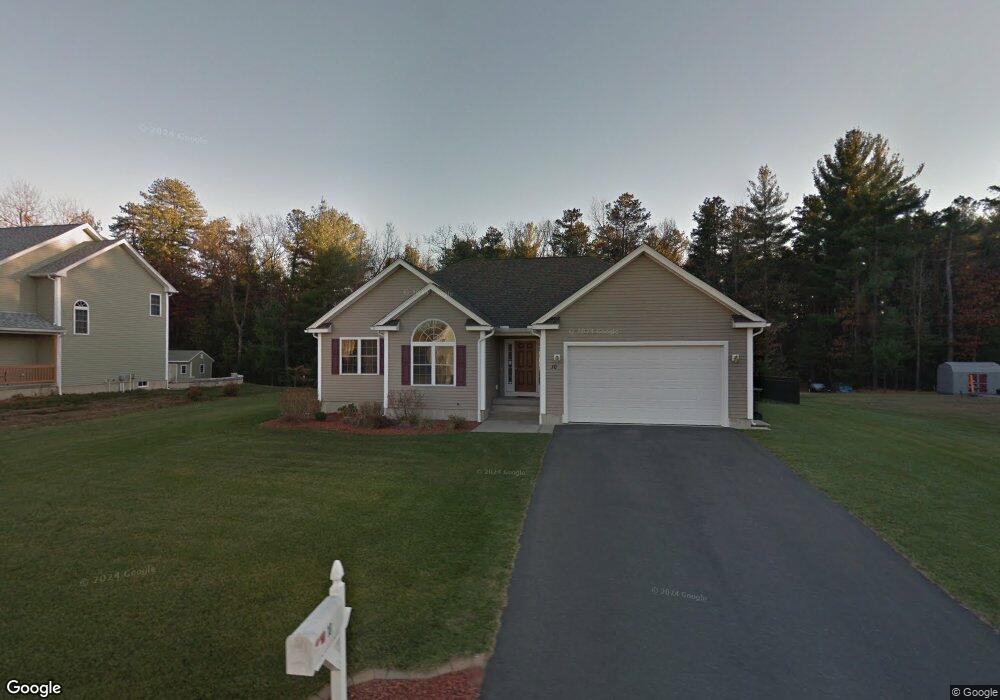
10 Willow Cir Easthampton, MA 01027
Estimated Value: $210,000 - $540,436
3
Beds
2
Baths
1,499
Sq Ft
$267/Sq Ft
Est. Value
About This Home
This home is located at 10 Willow Cir, Easthampton, MA 01027 and is currently estimated at $400,859, approximately $267 per square foot. 10 Willow Cir is a home located in Hampshire County with nearby schools including Easthampton High School, Calvary Baptist Christian School, and Tri-County Schools.
Ownership History
Date
Name
Owned For
Owner Type
Purchase Details
Closed on
Jun 11, 2010
Sold by
Czelusniak Custom Home
Bought by
Dise Paul R
Current Estimated Value
Home Financials for this Owner
Home Financials are based on the most recent Mortgage that was taken out on this home.
Original Mortgage
$200,000
Outstanding Balance
$134,958
Interest Rate
5.11%
Mortgage Type
Purchase Money Mortgage
Estimated Equity
$265,901
Purchase Details
Closed on
Dec 4, 2009
Sold by
Crown Meadow Corp
Bought by
Czelusniak Custom Hom
Create a Home Valuation Report for This Property
The Home Valuation Report is an in-depth analysis detailing your home's value as well as a comparison with similar homes in the area
Home Values in the Area
Average Home Value in this Area
Purchase History
| Date | Buyer | Sale Price | Title Company |
|---|---|---|---|
| Dise Paul R | $336,000 | -- | |
| Czelusniak Custom Hom | $120,000 | -- |
Source: Public Records
Mortgage History
| Date | Status | Borrower | Loan Amount |
|---|---|---|---|
| Open | Dise Paul R | $200,000 |
Source: Public Records
Tax History
| Year | Tax Paid | Tax Assessment Tax Assessment Total Assessment is a certain percentage of the fair market value that is determined by local assessors to be the total taxable value of land and additions on the property. | Land | Improvement |
|---|---|---|---|---|
| 2025 | $6,724 | $491,900 | $131,600 | $360,300 |
| 2024 | $6,494 | $478,900 | $127,800 | $351,100 |
| 2023 | $4,870 | $332,400 | $100,500 | $231,900 |
| 2022 | $5,495 | $332,400 | $100,500 | $231,900 |
| 2021 | $6,032 | $343,900 | $100,500 | $243,400 |
| 2020 | $5,903 | $332,400 | $100,500 | $231,900 |
| 2019 | $5,185 | $335,400 | $117,200 | $218,200 |
| 2018 | $4,963 | $310,200 | $110,400 | $199,800 |
| 2017 | $4,848 | $299,100 | $106,200 | $192,900 |
| 2016 | $4,725 | $303,100 | $106,200 | $196,900 |
| 2015 | $4,592 | $303,100 | $106,200 | $196,900 |
Source: Public Records
Map
Nearby Homes
- 29 Sandra Rd
- 4 Laurel Dr
- 36 & 36R Holly Cir
- 36 Line St
- 1 Plain St
- 95 Gunn Rd
- 245 Park St
- 7 Western View Rd
- 2 W Park Dr
- 6 S St & Abutting Lots
- Lot 3 Mountain Rd
- 48 Gunn Rd
- 41 South St Unit 11
- 36 County Rd
- 38 College Hwy
- 19 Mount Tom Ave Unit 19
- 385 Main St
- 19 Nicols Way Unit 19
- 2 Oak St
- 154 Madison Ave
Your Personal Tour Guide
Ask me questions while you tour the home.