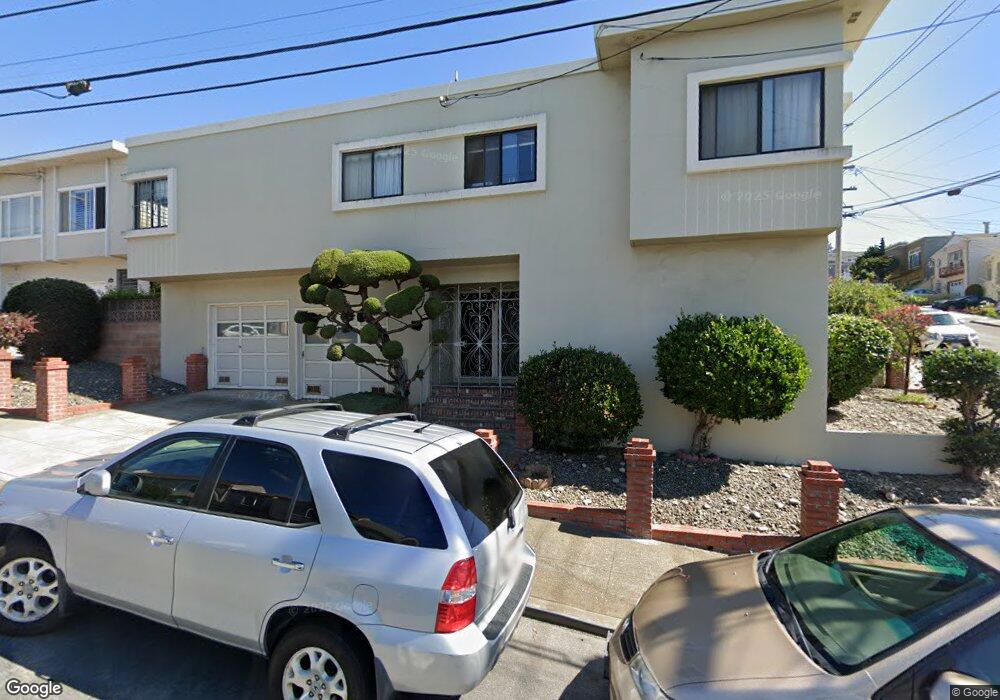
100 Monticello St San Francisco, CA 94132
Ingleside Heights NeighborhoodEstimated Value: $1,306,000 - $1,489,000
5
Beds
3
Baths
1,596
Sq Ft
$871/Sq Ft
Est. Value
About This Home
This home is located at 100 Monticello St, San Francisco, CA 94132 and is currently estimated at $1,389,737, approximately $870 per square foot. 100 Monticello St is a home located in San Francisco County with nearby schools including Ortega (Jose) Elementary School, Aptos Middle School, and Krouzian-Zekarian-Vasbouragan Armenian School.
Ownership History
Date
Name
Owned For
Owner Type
Purchase Details
Closed on
Sep 14, 1994
Sold by
Jackson Johnie Jean and Jackson Janis M
Bought by
Ma Keng Por and Ma Ellen Chi Ying
Current Estimated Value
Home Financials for this Owner
Home Financials are based on the most recent Mortgage that was taken out on this home.
Original Mortgage
$100,000
Interest Rate
8.61%
Create a Home Valuation Report for This Property
The Home Valuation Report is an in-depth analysis detailing your home's value as well as a comparison with similar homes in the area
Home Values in the Area
Average Home Value in this Area
Purchase History
| Date | Buyer | Sale Price | Title Company |
|---|---|---|---|
| Ma Keng Por | $277,000 | Commonwealth Land Title Co |
Source: Public Records
Mortgage History
| Date | Status | Borrower | Loan Amount |
|---|---|---|---|
| Closed | Ma Keng Por | $100,000 |
Source: Public Records
Tax History Compared to Growth
Tax History
| Year | Tax Paid | Tax Assessment Tax Assessment Total Assessment is a certain percentage of the fair market value that is determined by local assessors to be the total taxable value of land and additions on the property. | Land | Improvement |
|---|---|---|---|---|
| 2025 | $5,372 | $465,250 | $167,955 | $297,295 |
| 2024 | $5,372 | $456,128 | $164,662 | $291,466 |
| 2023 | $5,295 | $447,185 | $161,434 | $285,751 |
| 2022 | $5,201 | $438,418 | $158,269 | $280,149 |
| 2021 | $5,111 | $429,822 | $155,166 | $274,656 |
| 2020 | $5,125 | $425,415 | $153,575 | $271,840 |
| 2019 | $4,950 | $417,074 | $150,564 | $266,510 |
| 2018 | $5,373 | $408,897 | $147,612 | $261,285 |
| 2017 | $5,009 | $400,880 | $144,718 | $256,162 |
| 2016 | $4,904 | $393,021 | $141,881 | $251,140 |
| 2015 | $4,841 | $387,118 | $139,750 | $247,368 |
| 2014 | $4,713 | $379,536 | $137,013 | $242,523 |
Source: Public Records
Map
Nearby Homes
- 230 Ralston St
- 131 Beverly St
- 621 Shields St
- 119 Vernon St
- 73 Summit Way
- 118 Summit Way
- 150 Chester Ave
- 114 Saint Charles Ave
- 233 Sargent St
- 531 Arch St
- 424 Garfield St
- 475 Head St
- 532 Ramsell St
- 20 Sargent St
- 442 Bright St
- 8100 Oceanview Terrace Unit 112
- 8400 Oceanview Terrace Unit 305
- 274 Montana St
- 95 Santa Cruz Ave
- 914 Capitol Ave
- 836 Sargent St
- 830 Sargent St
- 114 Monticello St
- 824 Sargent St
- 118 Monticello St
- 818 Sargent St
- 122 Monticello St
- 107 Monticello St
- 111 Monticello St
- 101 Monticello St
- 60 Monticello St
- 115 Monticello St
- 812 Sargent St
- 126 Monticello St
- 119 Monticello St
- 115 Byxbee St
- 806 Sargent St
- 833 Sargent St
- 130 Monticello St
- 119 Byxbee St