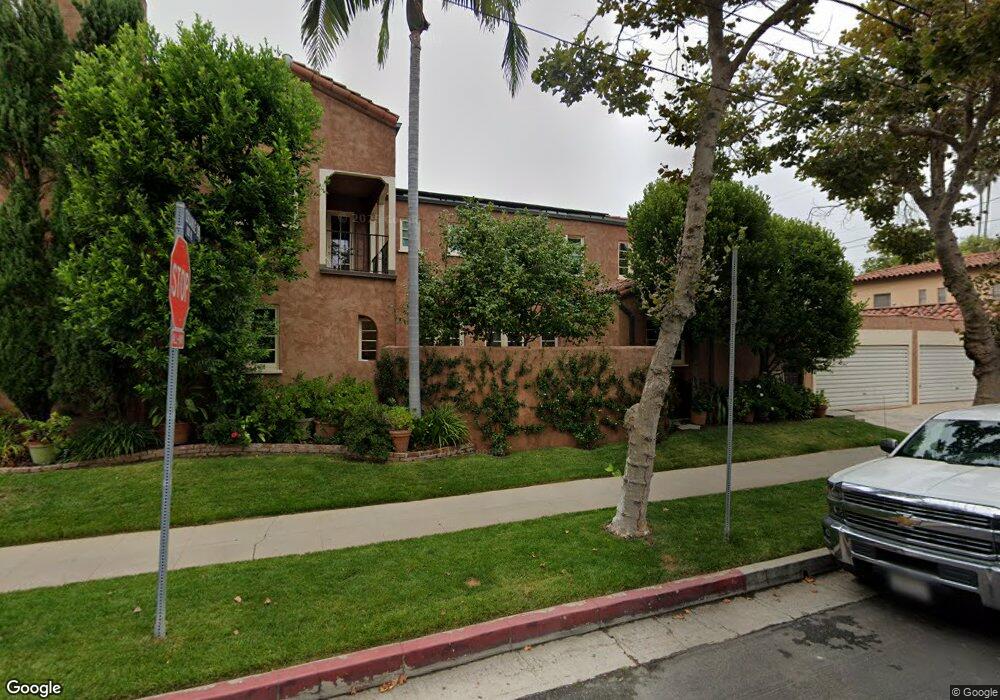
100 N Orange Dr Los Angeles, CA 90036
Hancock Park NeighborhoodEstimated Value: $2,086,000 - $3,142,678
6
Beds
4
Baths
4,510
Sq Ft
$559/Sq Ft
Est. Value
About This Home
This home is located at 100 N Orange Dr, Los Angeles, CA 90036 and is currently estimated at $2,523,170, approximately $559 per square foot. 100 N Orange Dr is a home located in Los Angeles County with nearby schools including Third Street Elementary School, John Burroughs Middle School, and Fairfax High School.
Ownership History
Date
Name
Owned For
Owner Type
Purchase Details
Closed on
Aug 30, 2019
Sold by
Wilson Evan N and Wilson Kathleen D
Bought by
Wilson Evan N and Wilson Kathleen D
Current Estimated Value
Home Financials for this Owner
Home Financials are based on the most recent Mortgage that was taken out on this home.
Original Mortgage
$915,000
Outstanding Balance
$803,106
Interest Rate
3.7%
Mortgage Type
New Conventional
Estimated Equity
$1,720,064
Purchase Details
Closed on
Dec 20, 2002
Sold by
Wilson Evan N and Wilson Kathleen D
Bought by
Wilson Evan N and Wilson Kathleen D
Purchase Details
Closed on
Sep 12, 2000
Sold by
Wilson Evan
Bought by
Wilson Evan N and Wilson Kathleen D
Home Financials for this Owner
Home Financials are based on the most recent Mortgage that was taken out on this home.
Original Mortgage
$40,000
Interest Rate
8.11%
Mortgage Type
Stand Alone Second
Create a Home Valuation Report for This Property
The Home Valuation Report is an in-depth analysis detailing your home's value as well as a comparison with similar homes in the area
Home Values in the Area
Average Home Value in this Area
Purchase History
| Date | Buyer | Sale Price | Title Company |
|---|---|---|---|
| Wilson Evan N | -- | Ticor Title Company Of Ca | |
| Willson Evan N | -- | Ticor Title Company Of Ca | |
| Wilson Evan N | -- | -- | |
| Wilson Evan N | -- | Southland Title Corporation |
Source: Public Records
Mortgage History
| Date | Status | Borrower | Loan Amount |
|---|---|---|---|
| Open | Willson Evan N | $915,000 | |
| Previous Owner | Wilson Evan N | $40,000 |
Source: Public Records
Tax History Compared to Growth
Tax History
| Year | Tax Paid | Tax Assessment Tax Assessment Total Assessment is a certain percentage of the fair market value that is determined by local assessors to be the total taxable value of land and additions on the property. | Land | Improvement |
|---|---|---|---|---|
| 2025 | $11,497 | $934,912 | $494,092 | $440,820 |
| 2024 | $11,497 | $916,581 | $484,404 | $432,177 |
| 2023 | $11,282 | $898,609 | $474,906 | $423,703 |
| 2022 | $10,771 | $880,991 | $465,595 | $415,396 |
| 2021 | $10,615 | $863,717 | $456,466 | $407,251 |
| 2019 | $10,301 | $838,101 | $442,928 | $395,173 |
| 2018 | $10,201 | $821,669 | $434,244 | $387,425 |
| 2016 | $9,719 | $789,765 | $417,383 | $372,382 |
| 2015 | $9,579 | $777,903 | $411,114 | $366,789 |
| 2014 | $9,618 | $762,666 | $403,061 | $359,605 |
Source: Public Records
Map
Nearby Homes
- 120 N Orange Dr
- 109 N Sycamore Ave Unit 102
- 143 N Sycamore Ave
- 147 N Detroit St
- 143 S Highland Ave
- 183 S Detroit St
- 203 S Detroit St Unit 201
- 420 N Orange Dr
- 157 N Las Palmas Ave
- 172 S Mccadden Place
- 434 N Mansfield Ave
- 160 S Poinsettia Place
- 500 N Mansfield Ave
- 101 S Fuller Ave
- 348 S Orange Dr
- 525 N Sycamore Ave Unit 326
- 358 S Sycamore Ave
- 322 N June St
- 191 S Hudson Ave
- 530 N Alta Vista Blvd
- 106 N Orange Dr
- 110 N Orange Dr Unit 12
- 110 N Orange Dr
- 112 N Orange Dr
- 100 S Orange Dr Unit 1
- 100 S Orange Dr
- 103 N Mansfield Ave
- 107 N Mansfield Ave
- 109 N Mansfield Ave
- 118 N Orange Dr
- 116 N Orange Dr
- 111 N Mansfield Ave Unit U
- 111 N Mansfield Ave
- 106 S Orange Dr
- 103 S Mansfield Ave
- 103 N Orange Dr
- 105 N Mansfield Ave
- 115 N Mansfield Ave Unit Lower
- 101 N Orange Dr
- 107 N Orange Dr