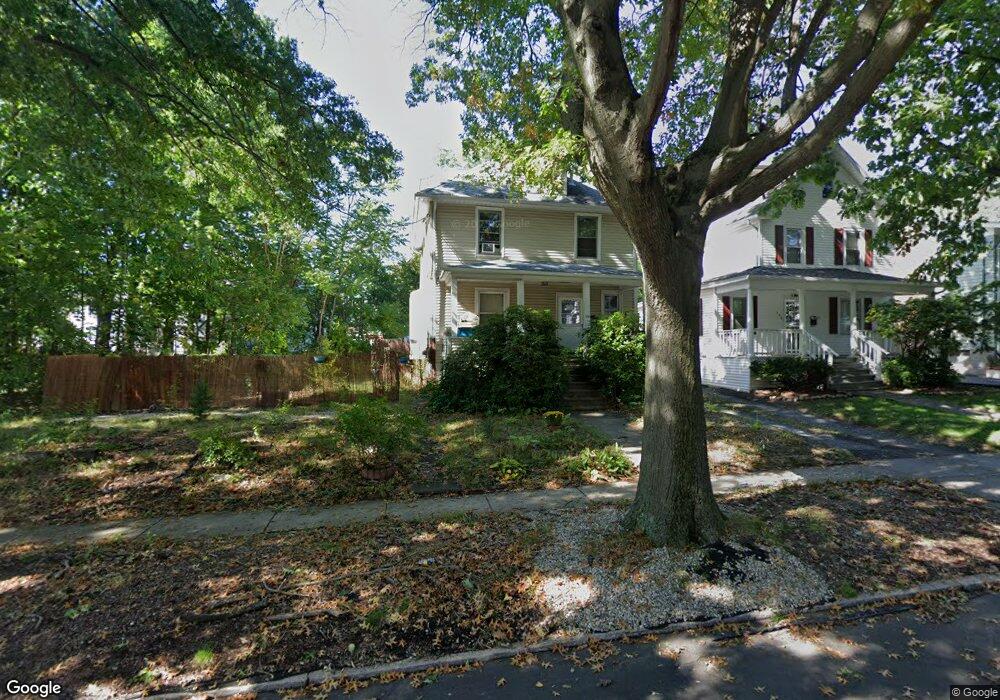
100 Osborn Ave New Haven, CT 06511
Beaver Hills NeighborhoodEstimated Value: $232,000 - $354,000
3
Beds
1
Bath
1,212
Sq Ft
$243/Sq Ft
Est. Value
About This Home
This home is located at 100 Osborn Ave, New Haven, CT 06511 and is currently estimated at $294,112, approximately $242 per square foot. 100 Osborn Ave is a home located in New Haven County with nearby schools including Beecher School, Elm City Montessori School, and Yeshiva Gedolah Rabbinical Inst.
Ownership History
Date
Name
Owned For
Owner Type
Purchase Details
Closed on
Dec 20, 2010
Sold by
Us Bk
Bought by
Juliano Robert and Hedreen Rebecca
Current Estimated Value
Purchase Details
Closed on
Sep 10, 2010
Sold by
Hairston Sherell
Bought by
Us Bk
Purchase Details
Closed on
Sep 26, 1994
Sold by
Mcgettigan Josephine M
Bought by
Newton James D
Create a Home Valuation Report for This Property
The Home Valuation Report is an in-depth analysis detailing your home's value as well as a comparison with similar homes in the area
Home Values in the Area
Average Home Value in this Area
Purchase History
| Date | Buyer | Sale Price | Title Company |
|---|---|---|---|
| Juliano Robert | $89,900 | -- | |
| Us Bk | -- | -- | |
| Newton James D | $60,000 | -- |
Source: Public Records
Mortgage History
| Date | Status | Borrower | Loan Amount |
|---|---|---|---|
| Previous Owner | Newton James D | $29,600 | |
| Previous Owner | Newton James D | $20,000 | |
| Previous Owner | Newton James D | $93,500 |
Source: Public Records
Tax History
| Year | Tax Paid | Tax Assessment Tax Assessment Total Assessment is a certain percentage of the fair market value that is determined by local assessors to be the total taxable value of land and additions on the property. | Land | Improvement |
|---|---|---|---|---|
| 2025 | $5,814 | $147,560 | $53,480 | $94,080 |
| 2024 | $5,681 | $147,560 | $53,480 | $94,080 |
| 2023 | $5,489 | $147,560 | $53,480 | $94,080 |
| 2022 | $5,866 | $147,560 | $53,480 | $94,080 |
| 2021 | $4,967 | $113,190 | $39,480 | $73,710 |
| 2020 | $4,967 | $113,190 | $39,480 | $73,710 |
| 2019 | $4,865 | $113,190 | $39,480 | $73,710 |
| 2018 | $4,865 | $113,190 | $39,480 | $73,710 |
| 2017 | $4,378 | $113,190 | $39,480 | $73,710 |
| 2016 | $3,947 | $94,990 | $23,030 | $71,960 |
| 2015 | $3,947 | $94,990 | $23,030 | $71,960 |
| 2014 | $3,857 | $92,820 | $23,030 | $69,790 |
Source: Public Records
Map
Nearby Homes
- 11 Young St
- 27 Blake St
- 257 Blake St
- 151 Fitch St
- 96 Hubinger St
- 14 Roger White Dr
- 907 Elm St
- 508 Yale Ave
- 595 Central Ave
- 1867 Ella T Grasso Blvd
- 57 Austin St
- 55 Carmel St
- 168 Ellsworth Ave
- 49 Carmel St
- 439 Edgewood Ave
- 420 Central Ave
- 290 Sherman Ave
- 381 Edgewood Ave
- 146 Springside Ave Unit B7
- 55 Marvel Rd
Your Personal Tour Guide
Ask me questions while you tour the home.