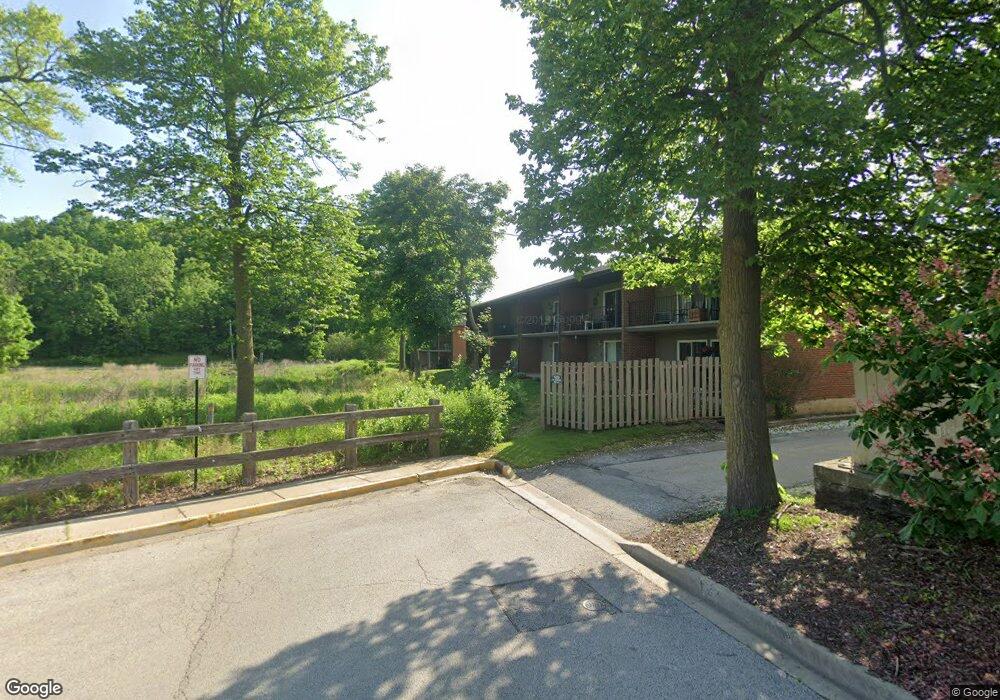
100 S Main St Unit R Algonquin, IL 60102
Estimated Value: $132,000 - $325,000
Studio
--
Bath
739
Sq Ft
$259/Sq Ft
Est. Value
About This Home
This home is located at 100 S Main St Unit R, Algonquin, IL 60102 and is currently estimated at $191,550, approximately $259 per square foot. 100 S Main St Unit R is a home located in McHenry County with nearby schools including Eastview Elementary School, Algonquin Middle School, and Dundee-Crown High School.
Ownership History
Date
Name
Owned For
Owner Type
Purchase Details
Closed on
Aug 8, 2022
Sold by
Vrmtg Asset Trust
Bought by
Hadzhidimitrov Vasil
Current Estimated Value
Purchase Details
Closed on
May 18, 2022
Sold by
Intercounty Judicial Sales Corporation
Bought by
Vrmtg Asset Trust
Purchase Details
Closed on
May 17, 2006
Sold by
Silva Mario and Silva Nancy M
Bought by
Razvi Omar H
Home Financials for this Owner
Home Financials are based on the most recent Mortgage that was taken out on this home.
Original Mortgage
$73,600
Interest Rate
6.62%
Mortgage Type
Fannie Mae Freddie Mac
Purchase Details
Closed on
May 4, 2001
Sold by
Algonquin State Bank
Bought by
Silva Mario and Silva Nancy M
Home Financials for this Owner
Home Financials are based on the most recent Mortgage that was taken out on this home.
Original Mortgage
$40,000
Interest Rate
6.99%
Create a Home Valuation Report for This Property
The Home Valuation Report is an in-depth analysis detailing your home's value as well as a comparison with similar homes in the area
Purchase History
| Date | Buyer | Sale Price | Title Company |
|---|---|---|---|
| Hadzhidimitrov Vasil | $76,000 | Ginali Associates Pc | |
| Vrmtg Asset Trust | -- | None Listed On Document | |
| Razvi Omar H | $92,000 | 1St American Title | |
| Silva Mario | $64,000 | Chicago Title Insurance Co |
Source: Public Records
Mortgage History
| Date | Status | Borrower | Loan Amount |
|---|---|---|---|
| Previous Owner | Razvi Omar H | $73,600 | |
| Previous Owner | Silva Mario | $40,000 |
Source: Public Records
Tax History
| Year | Tax Paid | Tax Assessment Tax Assessment Total Assessment is a certain percentage of the fair market value that is determined by local assessors to be the total taxable value of land and additions on the property. | Land | Improvement |
|---|---|---|---|---|
| 2024 | $2,238 | $28,608 | $6,318 | $22,290 |
| 2023 | $2,142 | $25,587 | $5,651 | $19,936 |
| 2022 | $1,854 | $27,624 | $7,719 | $19,905 |
| 2021 | $1,751 | $25,735 | $7,191 | $18,544 |
| 2020 | $1,690 | $24,824 | $6,936 | $17,888 |
| 2019 | $1,631 | $23,760 | $6,639 | $17,121 |
| 2018 | $1,520 | $21,949 | $6,133 | $15,816 |
| 2017 | $1,462 | $20,678 | $5,778 | $14,900 |
| 2016 | $1,409 | $19,394 | $5,419 | $13,975 |
| 2013 | -- | $19,897 | $5,055 | $14,842 |
Source: Public Records
Map
Nearby Homes
- 108 La Fox Dr
- 0 River Dr N Unit MRD12473279
- 407 La Fox River Dr
- 420 Summit St
- 600 E Algonquin Rd
- 615 Harper Dr
- 953 Old Oak Cir
- 719 Webster St
- 1188 E Algonquin Rd
- 530 Sunshine Ct
- 3 Sunset Ln
- 1200 Hillside View
- 313 Bayberry Dr
- Lot #3-5 Hayes Rd
- 9 Echowood Dr
- 944 Cynthia Ln
- 1030 Perry Dr
- 1302 Cary Rd
- 909 Roger St
- 935 Viewpoint Dr
- 100 S Main St Unit P
- 100 S Main St Unit O
- 100 S Main St Unit 18
- 100 S Main St Unit M12
- 100 S Main St Unit N
- 100 S Main St Unit K
- 100 S Main St Unit Q
- 100 S Main St Unit 17-R
- 100 S Main St Unit 17-R
- 100 S Main St Unit 10
- 100 S Main St Unit 14
- 100 S Main St Unit 13
- 100 S Main St Unit 15
- 111 Jefferson St Unit J
- 111 Jefferson St Unit H
- 111 Jefferson St Unit C
- 111 Jefferson St Unit B
- 111 Jefferson St Unit A
- 111 Jefferson St Unit E
- 111 Jefferson St Unit 1
Your Personal Tour Guide
Ask me questions while you tour the home.