
Seller's Agent in 2025
Maggie Bradford
Nettwork Global
(314) 495-0109
1 in this area
80 Total Sales


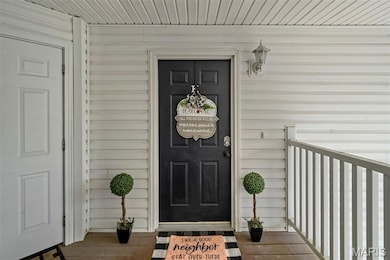
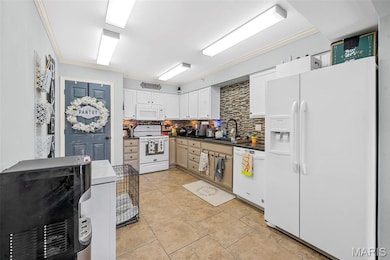
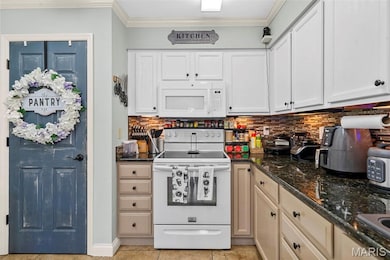
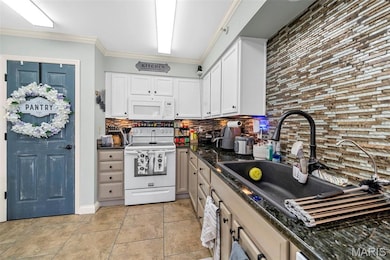
Prime location is everything & this 3rd floor unit is it! Close to the Historic District & has amazing features you won't find anywhere else in town! This condo is located on the upper level providing the open vaulted ceilings that so many desire. When you walk in you will notice the beautiful kitchen/dining combo that is ready for your gatherings while the natural lighting in the living room makes this condo so bright, airy, & inviting. There are TWO bedrooms & TWO FULL bathrooms; the laundry room is conveniently located just off the bedrooms. Relax on the deck type balcony just off the living room & enjoy all that your new condo has to offer. If your single or if you have small family this complex has the the space & security you desire. There's a generous sized storage unit perfect to keep those non ever day essentials in that is still easy accessible as it's right next to the unit! Conveniently located to shopping, dining & the HWY this condo is one that you won't want to miss! Schedule your showings today while in coming soon to get in Saturday & Sunday & Welcome Home to 100 Towne Square Ct. Unit #K!
*Showings to start Saturday 7/12 (SCHEDULE TODAY) please allow 24 hour response on all offers as always seller reserves the right to call for best & final, negotiate, & accept an offer at anytime. Thank you!
Last Agent to Sell the Property
Nettwork Global License #2019023210 Listed on: 07/11/2025
| Date | Type | Sale Price | Title Company |
|---|---|---|---|
| Warranty Deed | -- | None Listed On Document | |
| Warranty Deed | $97,000 | Us Title Ofallon | |
| Warranty Deed | $65,000 | Investors Title Co Clayton | |
| Corporate Deed | $77,263 | First American Title |
| Date | Status | Loan Amount | Loan Type |
|---|---|---|---|
| Previous Owner | $95,243 | FHA | |
| Previous Owner | $61,800 | No Value Available |
| Date | Event | Price | List to Sale | Price per Sq Ft |
|---|---|---|---|---|
| 08/18/2025 08/18/25 | Sold | -- | -- | -- |
| 07/13/2025 07/13/25 | Pending | -- | -- | -- |
| 07/11/2025 07/11/25 | For Sale | $155,000 | -- | $156 / Sq Ft |
| Year | Tax Paid | Tax Assessment Tax Assessment Total Assessment is a certain percentage of the fair market value that is determined by local assessors to be the total taxable value of land and additions on the property. | Land | Improvement |
|---|---|---|---|---|
| 2025 | $1,681 | $27,340 | $8,300 | $19,040 |
| 2024 | $1,681 | $22,520 | $1,790 | $20,730 |
| 2023 | $1,681 | $22,520 | $1,790 | $20,730 |
| 2022 | $1,626 | $20,250 | $5,660 | $14,590 |
| 2021 | $1,614 | $20,250 | $5,660 | $14,590 |
| 2020 | $1,538 | $18,450 | $4,710 | $13,740 |
| 2019 | $1,543 | $18,450 | $4,710 | $13,740 |
| 2018 | $1,422 | $16,040 | $2,640 | $13,400 |
| 2017 | $1,369 | $16,040 | $2,640 | $13,400 |
| 2016 | $1,397 | $15,730 | $3,020 | $12,710 |
| 2015 | $1,385 | $15,730 | $3,020 | $12,710 |
| 2014 | $1,414 | $15,690 | $3,400 | $12,290 |
Seller's Agent in 2025
Maggie Bradford
Nettwork Global
(314) 495-0109
1 in this area
80 Total Sales
Buyer's Agent in 2025
Brian Combs
Elevate Realty, LLC
(314) 591-7912
1 in this area
34 Total Sales
Source: MARIS MLS
MLS Number: MIS25046402
APN: 29V-34-0412
Disclaimer: Certain information contained herein is derived from information provided by parties other than Homes.com. All information provided is deemed reliable, but is not guaranteed to be accurate and should be independently verified.
![]() Based on information submitted to the MLS GRID. All data is obtained from various sources and may not have been verified by broker or MLS GRID. Supplied Open House Information is subject to change without notice. All information should be independently reviewed and verified for accuracy. Properties may or may not be listed by the office/agent presenting the information. Some IDX listings have been excluded from this website.
Based on information submitted to the MLS GRID. All data is obtained from various sources and may not have been verified by broker or MLS GRID. Supplied Open House Information is subject to change without notice. All information should be independently reviewed and verified for accuracy. Properties may or may not be listed by the office/agent presenting the information. Some IDX listings have been excluded from this website.
Based on information submitted to the MLS GRID
Ask me questions while you tour the home.