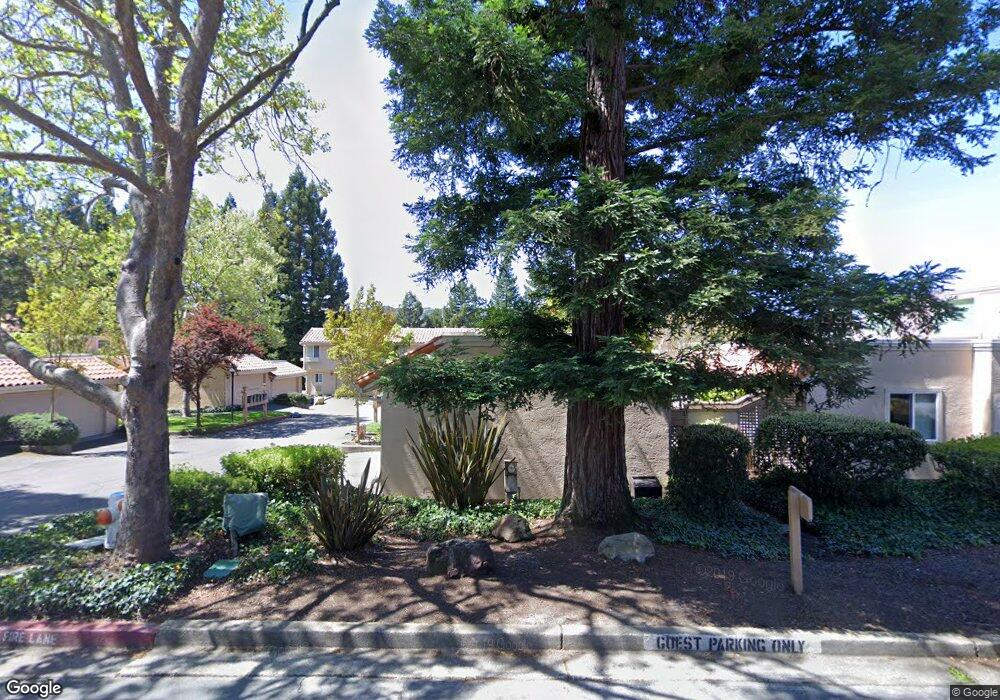
100 Via Joaquin Unit 1 Moraga, CA 94556
Saint Mary's NeighborhoodEstimated Value: $704,000 - $962,047
2
Beds
2
Baths
1,354
Sq Ft
$602/Sq Ft
Est. Value
About This Home
This home is located at 100 Via Joaquin Unit 1, Moraga, CA 94556 and is currently estimated at $815,012, approximately $601 per square foot. 100 Via Joaquin Unit 1 is a home located in Contra Costa County with nearby schools including Los Perales Elementary School, Joaquin Moraga Intermediate School, and Campolindo High School.
Ownership History
Date
Name
Owned For
Owner Type
Purchase Details
Closed on
Nov 19, 2018
Sold by
Mastick Stephen Gaylord and Mastick Bruce Alan
Bought by
Hess Monte R and Hess Katherine L
Current Estimated Value
Purchase Details
Closed on
Mar 12, 2007
Sold by
Mastick Elsie M
Bought by
Mastick Elsie M
Purchase Details
Closed on
Jul 26, 2000
Sold by
Victoria Gertmenian Kay and Victoria Alfred Gertmenian
Bought by
Mastick Elsie M
Home Financials for this Owner
Home Financials are based on the most recent Mortgage that was taken out on this home.
Original Mortgage
$297,200
Interest Rate
8.12%
Mortgage Type
Purchase Money Mortgage
Purchase Details
Closed on
Jan 23, 1996
Sold by
Hotchkiss James M
Bought by
Gertmenian Kay Victoria and Gertmenian Alfred
Home Financials for this Owner
Home Financials are based on the most recent Mortgage that was taken out on this home.
Original Mortgage
$170,000
Interest Rate
7.25%
Mortgage Type
Purchase Money Mortgage
Create a Home Valuation Report for This Property
The Home Valuation Report is an in-depth analysis detailing your home's value as well as a comparison with similar homes in the area
Home Values in the Area
Average Home Value in this Area
Purchase History
We collect this data history from publicly available records. To have your information removed, we recommend requesting removal directly through your county’s website.
| Date | Buyer | Sale Price | Title Company |
|---|---|---|---|
| Hess Monte R | $775,000 | Old Republic Title Orinda | |
| Mastick Elsie M | -- | None Available | |
| Mastick Elsie M | $371,500 | First American Title Guarant | |
| Gertmenian Kay Victoria | -- | First American Title Guarant | |
| Gertmenian Kay Victoria | $217,500 | Chicago Title Co |
Source: Public Records
Mortgage History
We collect this data history from publicly available records. To have your information removed, we recommend requesting removal directly through your county’s website.
| Date | Status | Borrower | Loan Amount |
|---|---|---|---|
| Previous Owner | Mastick Elsie M | $297,200 | |
| Previous Owner | Gertmenian Kay Victoria | $170,000 |
Source: Public Records
Tax History
| Year | Tax Paid | Tax Assessment Tax Assessment Total Assessment is a certain percentage of the fair market value that is determined by local assessors to be the total taxable value of land and additions on the property. | Land | Improvement |
|---|---|---|---|---|
| 2025 | $9,344 | $696,973 | $512,020 | $184,953 |
| 2024 | $8,816 | $683,308 | $501,981 | $181,327 |
| 2023 | $8,816 | $669,911 | $492,139 | $177,772 |
| 2022 | $8,720 | $656,777 | $482,490 | $174,287 |
| 2021 | $8,584 | $643,900 | $473,030 | $170,870 |
| 2019 | $8,435 | $624,802 | $459,000 | $165,802 |
| 2018 | $3,216 | $189,773 | $40,174 | $149,599 |
| 2017 | $3,149 | $186,053 | $39,387 | $146,666 |
| 2016 | $3,027 | $182,406 | $38,615 | $143,791 |
| 2015 | $2,990 | $179,667 | $38,035 | $141,632 |
| 2014 | $2,945 | $176,148 | $37,290 | $138,858 |
Source: Public Records
Map
Nearby Homes
- 1351 Camino Peral Unit C
- 1476 Camino Peral Unit C
- 295 Sandringham Dr N
- 1585 Moraga Way Unit 11
- 201 Willowbrook Ln
- 145 Danefield Place
- 1124 Sanders Dr
- 260 Corliss Dr
- 128 Corliss Dr
- 206 Sheila Ct
- 19 Lynwood Place
- 47 Greenfield Dr
- 1066 Larch Ave
- 34 Sherwood Ct
- 1712 Saint Andrews Dr
- 89 Greenfield Dr
- 59 Lynwood Place
- 1825 Saint Andrews Dr
- 106 Brookline St
- 7 Crockett Dr
- 104 Via Joaquin
- 108 Via Joaquin Unit 3
- 112 Via Joaquin
- 105 Via Joaquin Unit 26
- 101 Via Joaquin
- 109 Via Joaquin
- 116 Via Joaquin
- 120 Via Joaquin
- 1353 Camino Peral Unit B
- 1353 Camino Peral Unit A
- 136 Via Joaquin
- 145 Via Joaquin Unit 24
- 132 Via Joaquin
- 113 Via Joaquin
- 128 Via Joaquin
- 149 Via Joaquin Unit 23
- 1355 Camino Peral Unit A
- 1355 Camino Peral Unit B
- 124 Via Joaquin
- 117 Via Joaquin
Your Personal Tour Guide
Ask me questions while you tour the home.