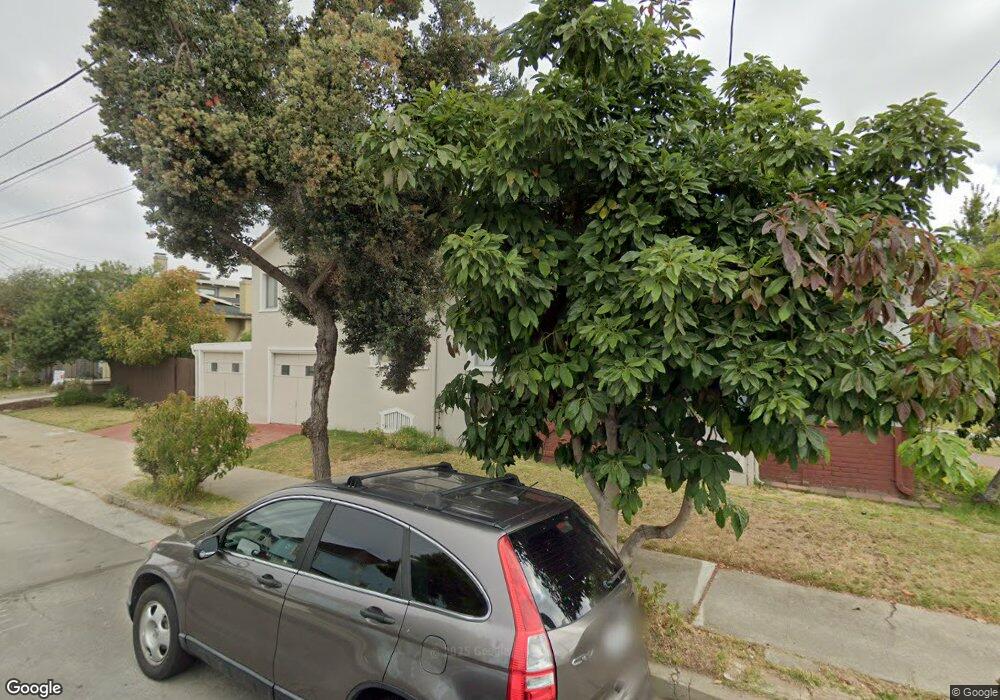
1001 Pearl St Alameda, CA 94501
South Shore NeighborhoodEstimated Value: $1,056,748 - $1,237,000
3
Beds
1
Bath
1,260
Sq Ft
$923/Sq Ft
Est. Value
About This Home
This home is located at 1001 Pearl St, Alameda, CA 94501 and is currently estimated at $1,163,437, approximately $923 per square foot. 1001 Pearl St is a home located in Alameda County with nearby schools including Frank Otis Elementary School, Lincoln Middle School, and Alameda High School.
Ownership History
Date
Name
Owned For
Owner Type
Purchase Details
Closed on
Apr 7, 2016
Sold by
Valez Shirley and The Hildeman Trust
Bought by
Valdez Shirley
Current Estimated Value
Purchase Details
Closed on
Nov 8, 2013
Sold by
Hildeman Lynn A
Bought by
Hildeman Lynn A and The Hildeman Trust
Purchase Details
Closed on
Jun 10, 2013
Sold by
Ho Esther W and Hildeman Trust
Bought by
Hildeman Lynn
Purchase Details
Closed on
May 3, 2013
Sold by
Ho Esther W and Esther W Ho Trust
Bought by
Ho Esther W and Hildeman Trust
Purchase Details
Closed on
Feb 26, 2013
Sold by
Ho Esther W and Hildeman Trust
Bought by
Ho Esther W and Esther W Ho Trust
Purchase Details
Closed on
Sep 22, 2004
Sold by
Hildeman Gene C
Bought by
Hildeman Gene C and The Gene C Hildeman Trust
Purchase Details
Closed on
Dec 22, 2003
Sold by
Hildeman Lynn A
Bought by
Hildeman Lynn A and The Hildeman Trust
Purchase Details
Closed on
Aug 24, 2001
Sold by
Hildeman Ethel L
Bought by
Hildeman Gene C and Hildeman Lynn A
Create a Home Valuation Report for This Property
The Home Valuation Report is an in-depth analysis detailing your home's value as well as a comparison with similar homes in the area
Home Values in the Area
Average Home Value in this Area
Purchase History
| Date | Buyer | Sale Price | Title Company |
|---|---|---|---|
| Valdez Shirley | -- | None Available | |
| Hildeman Lynn A | -- | None Available | |
| Hildeman Lynn | -- | None Available | |
| Ho Esther W | -- | None Available | |
| Ho Esther W | -- | None Available | |
| Hildeman Gene C | -- | -- | |
| Hildeman Lynn A | -- | -- | |
| Hildeman Gene C | -- | -- |
Source: Public Records
Tax History Compared to Growth
Tax History
| Year | Tax Paid | Tax Assessment Tax Assessment Total Assessment is a certain percentage of the fair market value that is determined by local assessors to be the total taxable value of land and additions on the property. | Land | Improvement |
|---|---|---|---|---|
| 2025 | $14,150 | $1,029,878 | $514,939 | $514,939 |
| 2024 | $14,150 | $1,009,686 | $504,843 | $504,843 |
| 2023 | $13,588 | $989,894 | $494,947 | $494,947 |
| 2022 | $13,275 | $970,484 | $485,242 | $485,242 |
| 2021 | $12,937 | $951,458 | $475,729 | $475,729 |
| 2020 | $12,775 | $941,704 | $470,852 | $470,852 |
| 2019 | $12,322 | $923,244 | $461,622 | $461,622 |
| 2018 | $12,005 | $905,148 | $452,574 | $452,574 |
| 2017 | $11,430 | $887,400 | $443,700 | $443,700 |
| 2016 | $5,246 | $341,143 | $115,877 | $225,266 |
| 2015 | $5,224 | $336,020 | $114,137 | $221,883 |
| 2014 | $5,007 | $329,439 | $111,902 | $217,537 |
Source: Public Records
Map
Nearby Homes
- 975 Pearl St
- 1024 Regent St
- 2829 Otis Dr
- 2839 Washington St
- 1210 Broadway Unit A
- 1100 Park Ave
- 2431 Roosevelt Dr
- 2848 San Jose Ave
- 954 Park St
- 2620 Encinal Ave
- 1238 Versailles Ave
- 935 Park St
- 840 Oak St
- 3171 Bayview Dr
- 3012 Bayview Dr
- 3208 Washington St
- 1251 Park St
- 2417 Marti Rae Ct
- 2308 Encinal Ave
- 2209 Otis Dr Unit L