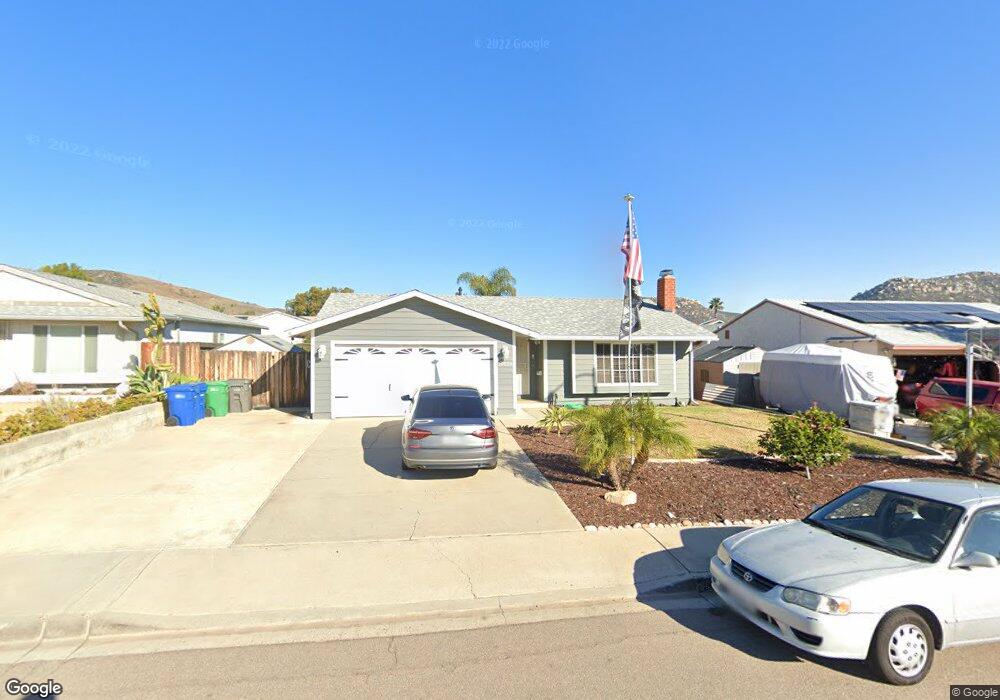
10028 Maple Tree Rd Santee, CA 92071
Estimated Value: $851,115 - $861,000
4
Beds
2
Baths
1,359
Sq Ft
$630/Sq Ft
Est. Value
About This Home
This home is located at 10028 Maple Tree Rd, Santee, CA 92071 and is currently estimated at $856,029, approximately $629 per square foot. 10028 Maple Tree Rd is a home located in San Diego County with nearby schools including Cajon Park Elementary School and Santana High School.
Ownership History
Date
Name
Owned For
Owner Type
Purchase Details
Closed on
Apr 13, 2016
Sold by
Prather Paul E and Prather Rebecca J
Bought by
Prather Paul E and Prather Rebecca J
Current Estimated Value
Home Financials for this Owner
Home Financials are based on the most recent Mortgage that was taken out on this home.
Original Mortgage
$448,787
Outstanding Balance
$356,534
Interest Rate
3.68%
Mortgage Type
VA
Estimated Equity
$499,495
Purchase Details
Closed on
Jul 9, 2015
Sold by
Digby Charles B and Digby Rhea M
Bought by
Prather Paul
Home Financials for this Owner
Home Financials are based on the most recent Mortgage that was taken out on this home.
Original Mortgage
$449,460
Interest Rate
3.98%
Mortgage Type
VA
Purchase Details
Closed on
Jul 31, 2003
Sold by
Digby Charles B and Digby Rhea M
Bought by
Digby Charles B and Digby Rhea M
Purchase Details
Closed on
Oct 28, 1985
Create a Home Valuation Report for This Property
The Home Valuation Report is an in-depth analysis detailing your home's value as well as a comparison with similar homes in the area
Purchase History
| Date | Buyer | Sale Price | Title Company |
|---|---|---|---|
| Prather Paul E | -- | Accommodation | |
| Prather Paul E | -- | Title365 Company | |
| Prather Paul | $440,000 | First American Title | |
| Digby Charles B | -- | -- | |
| -- | $108,500 | -- |
Source: Public Records
Mortgage History
| Date | Status | Borrower | Loan Amount |
|---|---|---|---|
| Open | Prather Paul E | $448,787 | |
| Closed | Prather Paul | $449,460 |
Source: Public Records
Tax History
| Year | Tax Paid | Tax Assessment Tax Assessment Total Assessment is a certain percentage of the fair market value that is determined by local assessors to be the total taxable value of land and additions on the property. | Land | Improvement |
|---|---|---|---|---|
| 2025 | $6,114 | $520,862 | $109,944 | $410,918 |
| 2024 | $6,114 | $510,650 | $107,789 | $402,861 |
| 2023 | $5,926 | $500,638 | $105,676 | $394,962 |
| 2022 | $5,882 | $490,822 | $103,604 | $387,218 |
| 2021 | $5,800 | $481,199 | $101,573 | $379,626 |
| 2020 | $5,728 | $476,266 | $100,532 | $375,734 |
| 2019 | $5,525 | $466,928 | $98,561 | $368,367 |
| 2018 | $5,411 | $457,774 | $96,629 | $361,145 |
| 2017 | $5,339 | $448,799 | $94,735 | $354,064 |
| 2016 | $5,176 | $440,000 | $92,878 | $347,122 |
| 2015 | $2,149 | $179,751 | $37,943 | $141,808 |
| 2014 | $2,106 | $176,231 | $37,200 | $139,031 |
Source: Public Records
Map
Nearby Homes
- 10143 Maple Tree Rd
- 10214 Michala Place
- 10209 Princess Sarit Way
- 9931 Beck Dr
- 10158 Carefree Dr
- 10219 Kerrigan St
- 10621 Keith St
- 10317 Santana Ranch Dr
- 10425 Nate Way
- 9942 Theresa Ln
- 9941 Woodpark Dr
- 10634 Sanfred Ct
- 10520 El Nopal
- 10135 Peaceful Ct
- 10009 Santana Ranch Ln
- 10606 N Magnolia Ave
- 10726 Ironwood Ave
- 10347 Carefree Dr
- 9821 Caspi Gardens Dr Unit 8
- 9829 Caspi Gardens Dr Unit 6
- 10022 Maple Tree Rd
- 10034 Maple Tree Rd
- 10025 Pinewood View
- 10016 Maple Tree Rd
- 10040 Maple Tree Rd
- 10019 Pinewood View
- 10033 Pinewood View
- 10027 Maple Tree Rd
- 10011 Pinewood View
- 10039 Pinewood View
- 10021 Maple Tree Rd
- 10033 Maple Tree Rd
- 10010 Maple Tree Rd
- 10046 Maple Tree Rd
- 10015 Maple Tree Rd
- 10039 Maple Tree Rd
- 10007 Pinewood View
- 10043 Pinewood View
- 10045 Maple Tree Rd
- 10004 Maple Tree Rd
Your Personal Tour Guide
Ask me questions while you tour the home.