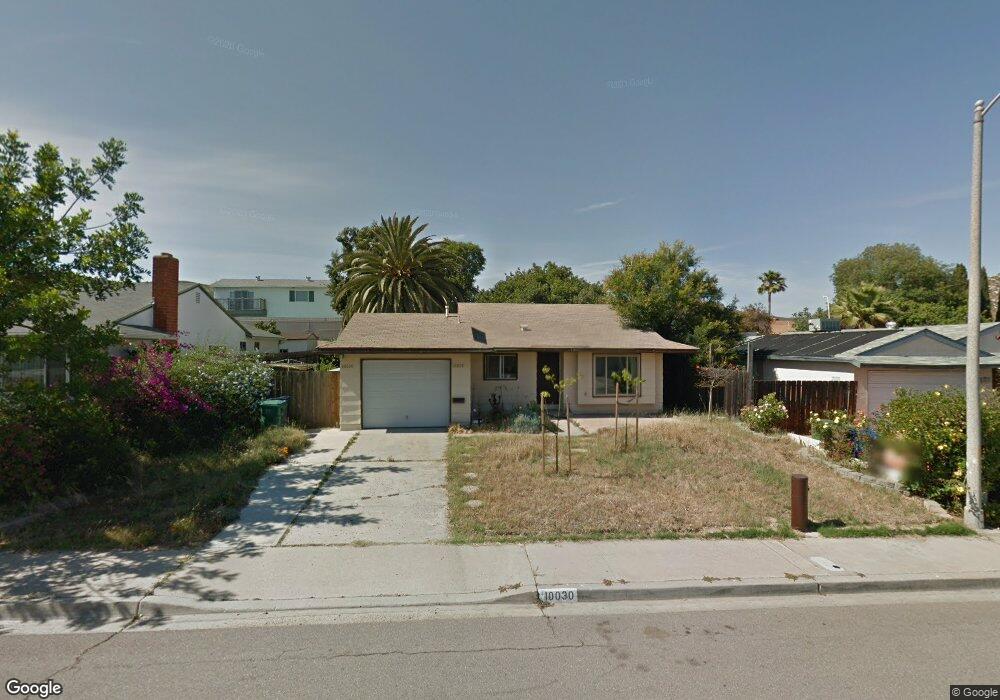
10030 Three Oaks Way Santee, CA 92071
Estimated Value: $724,000 - $861,000
2
Beds
2
Baths
1,319
Sq Ft
$609/Sq Ft
Est. Value
About This Home
This home is located at 10030 Three Oaks Way, Santee, CA 92071 and is currently estimated at $803,887, approximately $609 per square foot. 10030 Three Oaks Way is a home located in San Diego County with nearby schools including Cajon Park Elementary School and Santana High School.
Ownership History
Date
Name
Owned For
Owner Type
Purchase Details
Closed on
Nov 13, 2006
Sold by
Milligan Cyndy D
Bought by
Carlton Cyndy D
Current Estimated Value
Purchase Details
Closed on
Dec 9, 2002
Sold by
Milligan Samuel K
Bought by
Milligan Cyndy D
Home Financials for this Owner
Home Financials are based on the most recent Mortgage that was taken out on this home.
Original Mortgage
$135,000
Outstanding Balance
$56,401
Interest Rate
5.86%
Estimated Equity
$747,486
Purchase Details
Closed on
Dec 3, 2002
Sold by
Herrington Howard M
Bought by
Milligan Cyndy D
Home Financials for this Owner
Home Financials are based on the most recent Mortgage that was taken out on this home.
Original Mortgage
$135,000
Outstanding Balance
$56,401
Interest Rate
5.86%
Estimated Equity
$747,486
Purchase Details
Closed on
May 5, 1994
Sold by
Herrington Howard Michael
Bought by
Herrington Howard M
Create a Home Valuation Report for This Property
The Home Valuation Report is an in-depth analysis detailing your home's value as well as a comparison with similar homes in the area
Home Values in the Area
Average Home Value in this Area
Purchase History
| Date | Buyer | Sale Price | Title Company |
|---|---|---|---|
| Carlton Cyndy D | -- | None Available | |
| Milligan Cyndy D | -- | Equity Title Company | |
| Milligan Cyndy D | $265,000 | Equity Title Company | |
| Herrington Howard M | -- | -- |
Source: Public Records
Mortgage History
| Date | Status | Borrower | Loan Amount |
|---|---|---|---|
| Open | Milligan Cyndy D | $135,000 |
Source: Public Records
Tax History Compared to Growth
Tax History
| Year | Tax Paid | Tax Assessment Tax Assessment Total Assessment is a certain percentage of the fair market value that is determined by local assessors to be the total taxable value of land and additions on the property. | Land | Improvement |
|---|---|---|---|---|
| 2025 | $5,309 | $451,369 | $130,340 | $321,029 |
| 2024 | $5,309 | $442,520 | $127,785 | $314,735 |
| 2023 | $5,145 | $433,844 | $125,280 | $308,564 |
| 2022 | $5,106 | $425,338 | $122,824 | $302,514 |
| 2021 | $5,035 | $416,999 | $120,416 | $296,583 |
| 2020 | $4,972 | $412,724 | $119,182 | $293,542 |
| 2019 | $4,796 | $404,633 | $116,846 | $287,787 |
| 2018 | $4,697 | $396,700 | $114,555 | $282,145 |
| 2017 | $4,635 | $388,922 | $112,309 | $276,613 |
| 2016 | $4,493 | $381,297 | $110,107 | $271,190 |
| 2015 | $4,432 | $375,571 | $108,454 | $267,117 |
| 2014 | $4,071 | $345,000 | $103,808 | $241,192 |
Source: Public Records
Map
Nearby Homes
- 10036 Three Oaks Way
- 9945 Via Rita
- 10290 Lariat Dr
- 10158 Carefree Dr
- 10128 Peaceful Ct
- 9972 Via Francis
- 10185 Peaceful Ct Unit 64B2
- 10009 Santana Ranch Ln
- 10330 Kerrigan St
- 10258 Carefree Dr
- 9829 Caspi Gardens Dr Unit 6
- 10443 Nate Way
- 10634 Sanfred Ct
- 10658 King Phillip Ct
- 10525 Flora Verda Ct
- 10651 Trigal Way
- 10760 N Magnolia Ave Unit B6
- 10366 Rochelle Ave
- 10836 Stoney Creek Ct
- 9690 Bundy Dr
- 10024 Three Oaks Way
- 10027 Maple Tree Rd
- 10021 Maple Tree Rd
- 10033 Maple Tree Rd
- 10018 Three Oaks Way
- 10042 Three Oaks Way
- 10015 Maple Tree Rd
- 10039 Maple Tree Rd
- 10029 Three Oaks Way
- 10023 Three Oaks Way
- 10035 Three Oaks Way
- 10012 Three Oaks Way
- 10048 Three Oaks Way
- 10017 Three Oaks Way
- 10041 Three Oaks Way
- 10009 Maple Tree Rd
- 10045 Maple Tree Rd
- 10054 Three Oaks Way
- 10006 Three Oaks Way
- 10011 Three Oaks Way