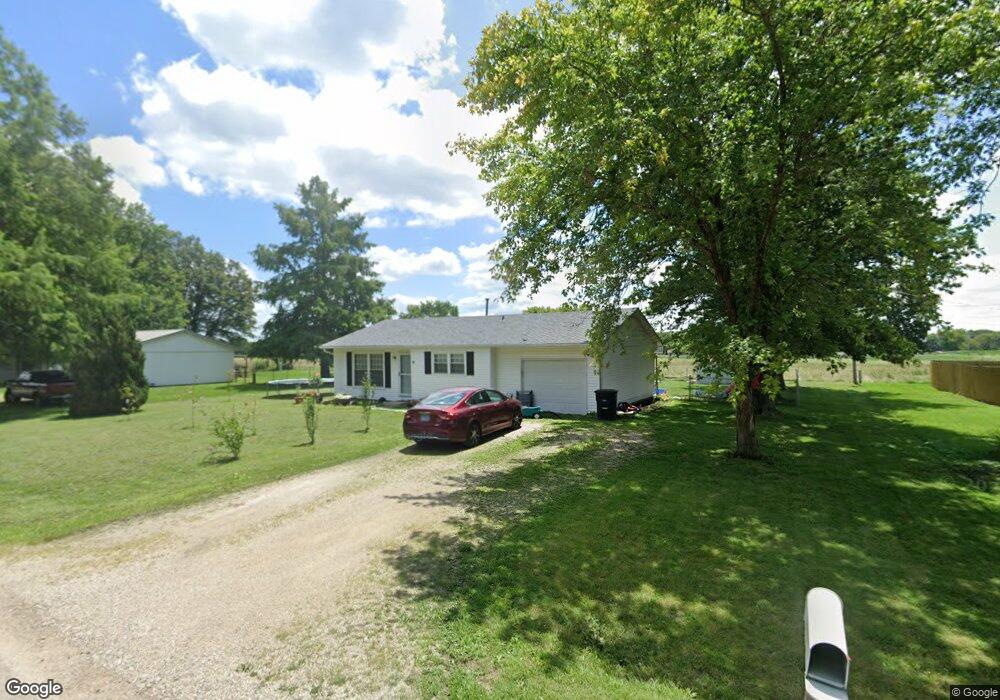
10035 E Heritage Dr Effingham, IL 62401
Estimated Value: $128,000 - $198,000
3
Beds
1
Bath
939
Sq Ft
$170/Sq Ft
Est. Value
About This Home
This home is located at 10035 E Heritage Dr, Effingham, IL 62401 and is currently estimated at $159,598, approximately $169 per square foot. 10035 E Heritage Dr is a home located in Effingham County with nearby schools including South Side Grade School, Early Learning Center, and Central Grade School.
Ownership History
Date
Name
Owned For
Owner Type
Purchase Details
Closed on
Mar 24, 2022
Sold by
Hall Jonathon E
Bought by
Bateman Zachary
Current Estimated Value
Home Financials for this Owner
Home Financials are based on the most recent Mortgage that was taken out on this home.
Original Mortgage
$116,666
Outstanding Balance
$109,600
Interest Rate
4.42%
Mortgage Type
New Conventional
Estimated Equity
$49,998
Purchase Details
Closed on
Aug 2, 2019
Sold by
Plummer Jessica L
Bought by
Hall Jonathon E
Home Financials for this Owner
Home Financials are based on the most recent Mortgage that was taken out on this home.
Original Mortgage
$104,030
Interest Rate
4%
Mortgage Type
New Conventional
Purchase Details
Closed on
Apr 23, 2013
Sold by
Arnold Jeffrey R and Arnold Jennifer Elizabeth
Bought by
Plummer Jessica L
Home Financials for this Owner
Home Financials are based on the most recent Mortgage that was taken out on this home.
Original Mortgage
$73,024
Interest Rate
3.56%
Mortgage Type
USDA
Create a Home Valuation Report for This Property
The Home Valuation Report is an in-depth analysis detailing your home's value as well as a comparison with similar homes in the area
Purchase History
| Date | Buyer | Sale Price | Title Company |
|---|---|---|---|
| Bateman Zachary | -- | None Listed On Document | |
| Hall Jonathon E | $100,000 | Burnet Title | |
| Plummer Jessica L | $65,500 | None Available |
Source: Public Records
Mortgage History
| Date | Status | Borrower | Loan Amount |
|---|---|---|---|
| Open | Bateman Zachary | $116,666 | |
| Previous Owner | Hall Jonathon E | $104,030 | |
| Previous Owner | Plummer Jessica L | $73,024 |
Source: Public Records
Tax History
| Year | Tax Paid | Tax Assessment Tax Assessment Total Assessment is a certain percentage of the fair market value that is determined by local assessors to be the total taxable value of land and additions on the property. | Land | Improvement |
|---|---|---|---|---|
| 2024 | $1,635 | $36,530 | $3,350 | $33,180 |
| 2023 | $1,456 | $33,060 | $3,030 | $30,030 |
| 2022 | $1,356 | $30,620 | $2,810 | $27,810 |
| 2021 | $1,281 | $29,170 | $2,680 | $26,490 |
| 2020 | $1,224 | $28,050 | $2,580 | $25,470 |
| 2019 | $1,179 | $27,230 | $2,500 | $24,730 |
| 2018 | $1,116 | $25,930 | $2,380 | $23,550 |
| 2017 | $1,095 | $25,420 | $2,330 | $23,090 |
| 2016 | $1,044 | $24,330 | $2,230 | $22,100 |
| 2015 | -- | $24,090 | $2,210 | $21,880 |
| 2014 | -- | $23,850 | $2,190 | $21,660 |
| 2013 | -- | $23,850 | $2,190 | $21,660 |
| 2012 | -- | $23,850 | $2,190 | $21,660 |
Source: Public Records
Map
Nearby Homes
- 15205 N Siemer Rd
- 14704 N Court 1
- 15872 N Bluebird Dr
- 14744 N Court 1
- 10028 Pineridge Rd
- 9219 E Best Ct
- 9284 E Court 11
- 14689 N Court 6
- 15047 N Colony Ln
- 11107 E Cambridge Ln
- 14748 N Court 7
- 11020 E Lake Edward Ln
- 11284 E Lincolnshire Ln
- 15052 N 16th Ave
- 16852 Willow Ridge Dr
- 15482 N Wildwood Dr
- 16035 N 850th St
- 15981 N Hillcrest Dr
- 24 N Country Club Rd
- 21 N Country Club Rd
- 10057 E Heritage Dr
- 10017 E Heritage Dr
- 10034 E Heritage Acres
- 10034 E Heritage Dr
- 10075 E Heritage Acres
- 10075 E Heritage Dr
- 10016 E Heritage Dr
- 10056 E Heritage Dr
- 10078 E Heritage Dr
- 15600 N 1000th St
- 10095 E Heritage Dr
- 0 Lake Sara Rd
- 10132 E Heritage Dr
- 10139 E Heritage Dr
- 9964 E Bloomfield Hills Dr
- 10165 E Heritage Dr
- 10162 E Heritage Dr
- 9944 E Bloomfield Hills Dr
- 9944 E Bloomfield Dr
- 9726 E Bloomfield Hills Dr
Your Personal Tour Guide
Ask me questions while you tour the home.