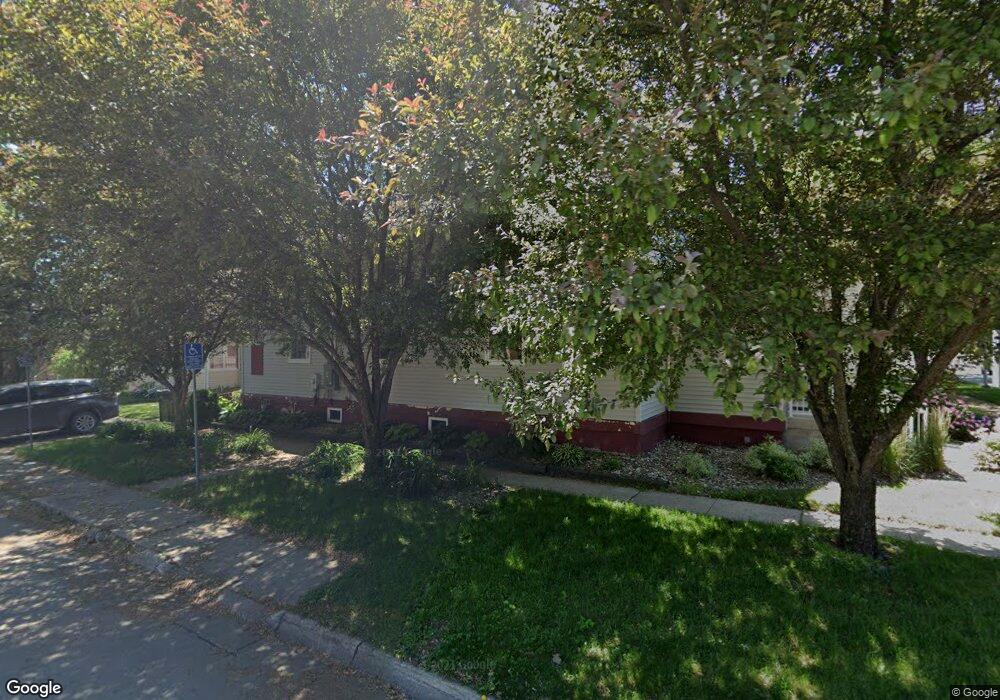
1004 Main St Cedar Falls, IA 50613
Estimated Value: $323,246
--
Bed
--
Bath
3,128
Sq Ft
$103/Sq Ft
Est. Value
About This Home
This home is located at 1004 Main St, Cedar Falls, IA 50613 and is currently priced at $323,246, approximately $103 per square foot. 1004 Main St is a home located in Black Hawk County with nearby schools including Lincoln Elementary School, Holmes Junior High School, and Cedar Falls High School.
Ownership History
Date
Name
Owned For
Owner Type
Purchase Details
Closed on
Apr 27, 2017
Sold by
Kbs Investments Llc
Bought by
Welsh Investments Llc
Current Estimated Value
Home Financials for this Owner
Home Financials are based on the most recent Mortgage that was taken out on this home.
Original Mortgage
$172,000
Outstanding Balance
$88,680
Interest Rate
4.14%
Mortgage Type
Commercial
Create a Home Valuation Report for This Property
The Home Valuation Report is an in-depth analysis detailing your home's value as well as a comparison with similar homes in the area
Home Values in the Area
Average Home Value in this Area
Purchase History
| Date | Buyer | Sale Price | Title Company |
|---|---|---|---|
| Welsh Investments Llc | $215,000 | None Available |
Source: Public Records
Mortgage History
| Date | Status | Borrower | Loan Amount |
|---|---|---|---|
| Open | Welsh Investments Llc | $172,000 |
Source: Public Records
Tax History Compared to Growth
Tax History
| Year | Tax Paid | Tax Assessment Tax Assessment Total Assessment is a certain percentage of the fair market value that is determined by local assessors to be the total taxable value of land and additions on the property. | Land | Improvement |
|---|---|---|---|---|
| 2025 | $3,564 | $229,610 | $25,800 | $203,810 |
| 2024 | $3,564 | $221,450 | $25,800 | $195,650 |
| 2023 | $2,838 | $221,450 | $25,800 | $195,650 |
| 2022 | $3,062 | $153,780 | $40,000 | $113,780 |
| 2021 | $3,072 | $153,780 | $40,000 | $113,780 |
| 2020 | $3,112 | $153,780 | $40,000 | $113,780 |
| 2019 | $3,112 | $138,980 | $25,200 | $113,780 |
| 2018 | $3,280 | $138,980 | $25,200 | $113,780 |
| 2017 | $3,386 | $138,980 | $25,200 | $113,780 |
| 2016 | $3,272 | $138,980 | $25,200 | $113,780 |
| 2015 | $3,272 | $138,980 | $25,200 | $113,780 |
| 2014 | $2,748 | $153,780 | $40,000 | $113,780 |
Source: Public Records
Map
Nearby Homes