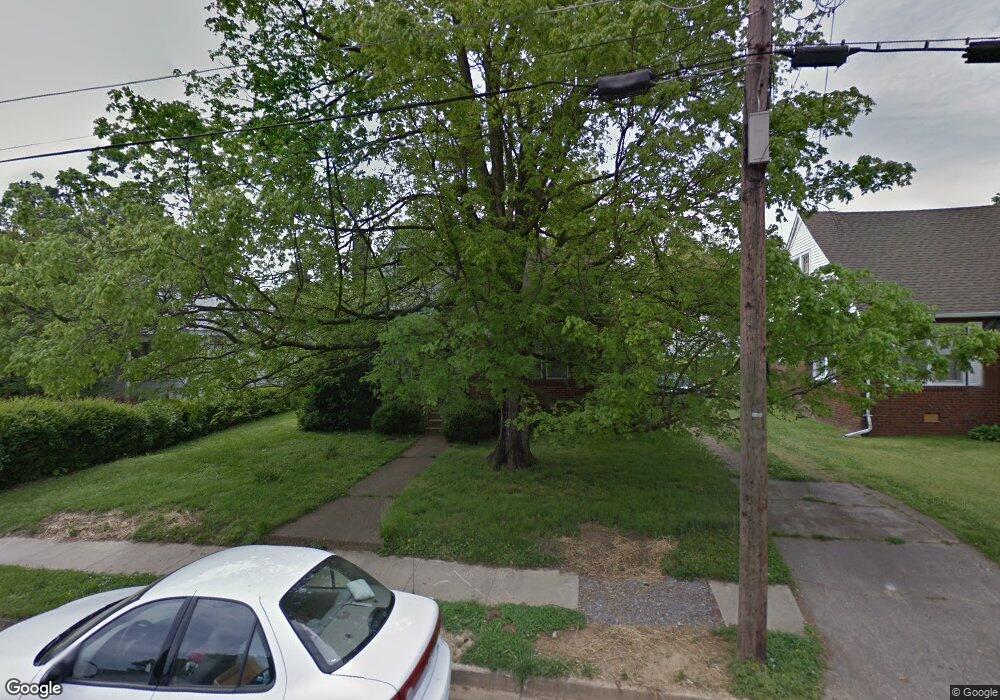
1005 High St Union City, TN 38261
Estimated Value: $104,000 - $186,000
--
Bed
2
Baths
1,287
Sq Ft
$122/Sq Ft
Est. Value
About This Home
This home is located at 1005 High St, Union City, TN 38261 and is currently estimated at $157,190, approximately $122 per square foot. 1005 High St is a home located in Obion County with nearby schools including Union City Elementary School, Union City Middle School, and Union City High School.
Ownership History
Date
Name
Owned For
Owner Type
Purchase Details
Closed on
Oct 17, 2024
Sold by
Hale Brian and Hale Darla
Bought by
Roberson Sydney A
Current Estimated Value
Home Financials for this Owner
Home Financials are based on the most recent Mortgage that was taken out on this home.
Original Mortgage
$152,192
Outstanding Balance
$150,442
Interest Rate
6.35%
Mortgage Type
FHA
Estimated Equity
$6,748
Purchase Details
Closed on
Nov 2, 2023
Sold by
Barkley Brittny L and Barkley Luann K
Bought by
Hale Brian and Hale Darla
Purchase Details
Closed on
Sep 14, 2022
Sold by
Andrew Cox James
Bought by
Cox Charles Sanford
Purchase Details
Closed on
Jan 1, 1942
Bought by
Cox Mrs Katherine
Create a Home Valuation Report for This Property
The Home Valuation Report is an in-depth analysis detailing your home's value as well as a comparison with similar homes in the area
Home Values in the Area
Average Home Value in this Area
Purchase History
| Date | Buyer | Sale Price | Title Company |
|---|---|---|---|
| Roberson Sydney A | $155,000 | None Listed On Document | |
| Hale Brian | $140,000 | None Listed On Document | |
| Cox Charles Sanford | $45,000 | -- | |
| Cox Charles Sanford | $45,000 | None Listed On Document | |
| Cox Mrs Katherine | -- | -- |
Source: Public Records
Mortgage History
| Date | Status | Borrower | Loan Amount |
|---|---|---|---|
| Open | Roberson Sydney A | $152,192 |
Source: Public Records
Tax History Compared to Growth
Tax History
| Year | Tax Paid | Tax Assessment Tax Assessment Total Assessment is a certain percentage of the fair market value that is determined by local assessors to be the total taxable value of land and additions on the property. | Land | Improvement |
|---|---|---|---|---|
| 2025 | -- | $18,325 | $0 | $0 |
| 2024 | -- | $18,325 | $2,000 | $16,325 |
| 2023 | $389 | $13,875 | $2,000 | $11,875 |
| 2022 | $190 | $11,850 | $2,000 | $9,850 |
| 2021 | $186 | $11,850 | $2,000 | $9,850 |
| 2020 | $190 | $11,850 | $2,000 | $9,850 |
| 2019 | $441 | $11,850 | $2,000 | $9,850 |
| 2018 | $439 | $11,850 | $2,000 | $9,850 |
| 2017 | $429 | $11,250 | $2,000 | $9,250 |
| 2016 | $429 | $11,250 | $2,000 | $9,250 |
| 2015 | $427 | $11,250 | $2,000 | $9,250 |
| 2014 | $427 | $11,250 | $2,000 | $9,250 |
Source: Public Records
Map
Nearby Homes
- 817 Exchange St
- 803 E Main St
- 724 E Martin Luther King
- 901 S Home St
- 0 S Miles Ave Unit 41030
- 633 E Jackson St
- 610 Perkins St
- 1009 E Cheatham St
- 501 N 1st St
- 616 S 3rd St
- 1813 E Vine St
- 1326 Holiday Rd
- 922 N Division St
- 1361 S Miles Ave
- 0 Tennessee 431
- 605 S 5th St
- 1319 Honeysuckle Dr
- 803 Nelson St
- 713 Nelson St
- 1129 S 4th St