Estimated Value: $111,520 - $188,000
4
Beds
2
Baths
1,632
Sq Ft
$92/Sq Ft
Est. Value
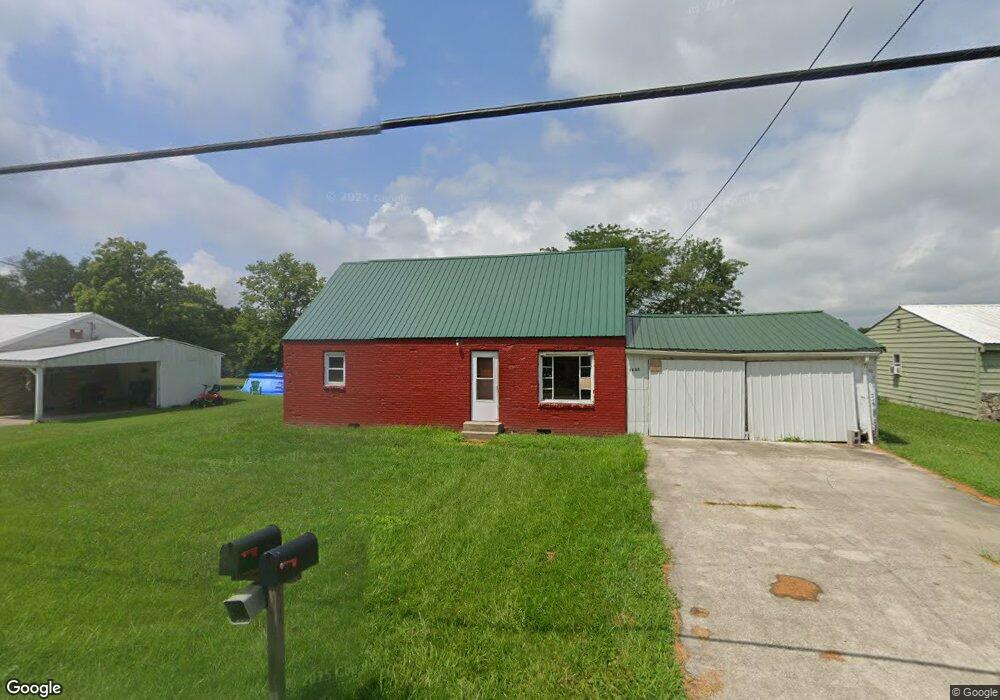
About This Home
This home is located at 1005 S Pittenger Rd, Selma, IN 47383 and is currently estimated at $150,880, approximately $92 per square foot. 1005 S Pittenger Rd is a home located in Delaware County with nearby schools including Selma Elementary School, Selma Middle School, and Wapahani High School.
Ownership History
Date
Name
Owned For
Owner Type
Purchase Details
Closed on
Jan 31, 2022
Sold by
Huntington Franklin P
Bought by
Aarh In Holdings Llc
Current Estimated Value
Home Financials for this Owner
Home Financials are based on the most recent Mortgage that was taken out on this home.
Original Mortgage
$100,000
Interest Rate
3.56%
Mortgage Type
Construction
Purchase Details
Closed on
Apr 15, 2019
Sold by
Huntington Franklin
Bought by
Huntington Gary P
Purchase Details
Closed on
Oct 12, 2005
Sold by
Little Curtis W and Mills Holli M
Bought by
Simpson William and Simpson Leisa
Home Financials for this Owner
Home Financials are based on the most recent Mortgage that was taken out on this home.
Original Mortgage
$13,000
Interest Rate
6.04%
Mortgage Type
Stand Alone Second
Create a Home Valuation Report for This Property
The Home Valuation Report is an in-depth analysis detailing your home's value as well as a comparison with similar homes in the area
Home Values in the Area
Average Home Value in this Area
Purchase History
| Date | Buyer | Sale Price | Title Company |
|---|---|---|---|
| Aarh In Holdings Llc | $21,000 | New Title Company Name | |
| Huntington Gary P | -- | None Available | |
| Simpson William | -- | None Available |
Source: Public Records
Mortgage History
| Date | Status | Borrower | Loan Amount |
|---|---|---|---|
| Closed | Aarh In Holdings Llc | $100,000 | |
| Previous Owner | Simpson William | $13,000 |
Source: Public Records
Tax History
| Year | Tax Paid | Tax Assessment Tax Assessment Total Assessment is a certain percentage of the fair market value that is determined by local assessors to be the total taxable value of land and additions on the property. | Land | Improvement |
|---|---|---|---|---|
| 2025 | $1,258 | $69,800 | $10,300 | $59,500 |
| 2024 | $1,258 | $57,900 | $10,300 | $47,600 |
| 2023 | $1,264 | $58,200 | $10,300 | $47,900 |
| 2022 | $1,210 | $55,500 | $10,300 | $45,200 |
| 2021 | $1,060 | $48,000 | $8,200 | $39,800 |
| 2020 | $956 | $42,800 | $8,200 | $34,600 |
| 2019 | $916 | $40,800 | $7,800 | $33,000 |
| 2018 | $898 | $39,900 | $7,500 | $32,400 |
| 2017 | $1,178 | $53,900 | $7,500 | $46,400 |
| 2016 | $1,110 | $50,500 | $7,500 | $43,000 |
| 2014 | $1,028 | $50,900 | $7,600 | $43,300 |
| 2013 | -- | $59,300 | $8,500 | $50,800 |
Source: Public Records
Map
Nearby Homes
- 10009 E Jackson St
- 2510 S Whitney Rd
- 204 N Cook Rd
- 3000 Blk S Cr 575 E
- 700 N Cook Rd
- 5704 E Robert St
- 401 N Gray St
- 0 E Fairway Dr
- 7201 E Windsor Rd
- 4838 E Jackson St
- 4708 E Heritage Cir
- 4308 E Maple Manor Pkwy
- 6504 S 560 Rd E
- 2300 N Country Club Rd
- 146 W Washington St
- 11990 E County Road 400 S
- 411 N State St
- 0 S Burlington Unit 202507671
- 0 S Burlington Unit 26211996
- 0 S Burlington Unit MBR22082608
- 1009 S Pittenger Rd
- 1001 S Pittenger Rd
- 915 S Pittenger Rd
- 1015 S Pittenger Rd
- 1000 S Pittenger Rd
- 1004 S Pittenger Rd
- 1101 S Pittenger Rd
- 1008 S Pittenger Rd
- 1012 S Pittenger Rd
- 909 S Pittenger Rd
- 1105 S Pittenger Rd
- 916 S Pittenger Rd
- 1100 S Pittenger Rd
- 1109 S Pittenger Rd
- 905 S Pittenger Rd
- 1115 S Pittenger Rd
- 816 S Pittenger Rd
- 1201 S Pittenger Rd
- 1116 S Pittenger Rd
- 1200 S Pittenger Rd
Your Personal Tour Guide
Ask me questions while you tour the home.