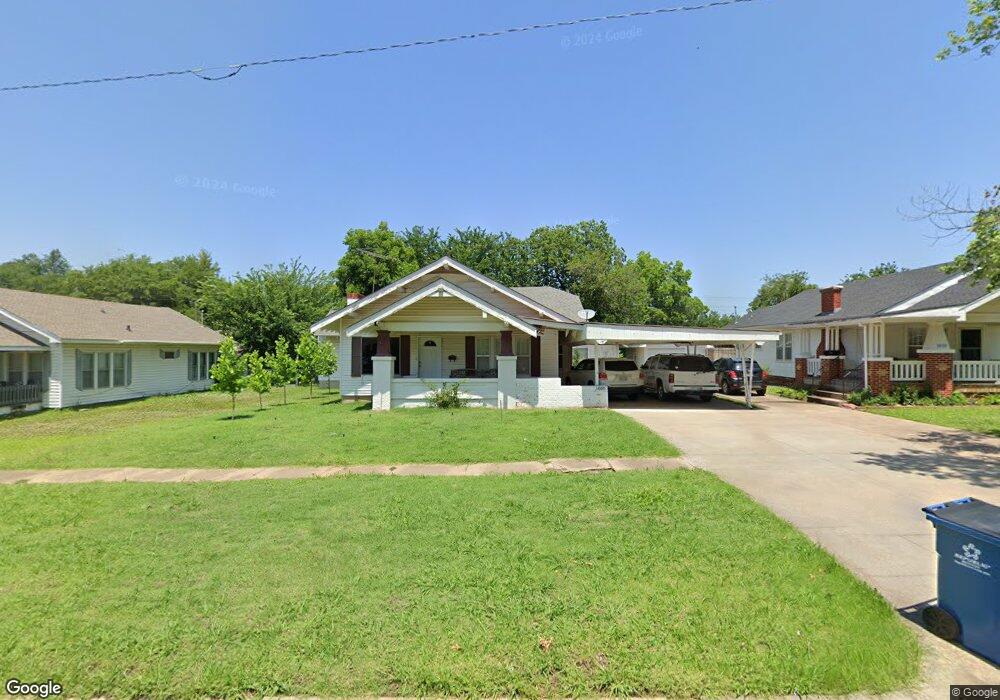
1006 E Broadway St Cushing, OK 74023
Estimated Value: $111,000 - $152,130
3
Beds
2
Baths
1,793
Sq Ft
$77/Sq Ft
Est. Value
About This Home
This home is located at 1006 E Broadway St, Cushing, OK 74023 and is currently estimated at $137,533, approximately $76 per square foot. 1006 E Broadway St is a home located in Payne County with nearby schools including Cushing Upper Elementary School, Cushing Lower Elementary School, and Cushing High School.
Ownership History
Date
Name
Owned For
Owner Type
Purchase Details
Closed on
Feb 28, 2018
Sold by
Dorle Jawanda
Bought by
Dorie Don
Current Estimated Value
Purchase Details
Closed on
May 23, 2014
Sold by
Poe Linda and Poe Kenneth
Bought by
Dorle Don and Dorle Jawanda
Home Financials for this Owner
Home Financials are based on the most recent Mortgage that was taken out on this home.
Original Mortgage
$78,291
Interest Rate
4.38%
Mortgage Type
Purchase Money Mortgage
Purchase Details
Closed on
Jul 29, 2009
Sold by
Welch Gloria C
Bought by
Poe Linda and Poe Kenneth
Home Financials for this Owner
Home Financials are based on the most recent Mortgage that was taken out on this home.
Original Mortgage
$88,369
Interest Rate
5.41%
Mortgage Type
FHA
Purchase Details
Closed on
Oct 7, 2005
Sold by
Palmer Jason B and Palmer Tracy L
Bought by
Welch Gloria
Create a Home Valuation Report for This Property
The Home Valuation Report is an in-depth analysis detailing your home's value as well as a comparison with similar homes in the area
Purchase History
| Date | Buyer | Sale Price | Title Company |
|---|---|---|---|
| Dorie Don | -- | -- | |
| Dorle Don | $87,000 | American Eagle Title Group L | |
| Poe Linda | $90,000 | -- | |
| Welch Gloria | $70,000 | None Available |
Source: Public Records
Mortgage History
| Date | Status | Borrower | Loan Amount |
|---|---|---|---|
| Previous Owner | Dorle Don | $78,291 | |
| Previous Owner | Poe Linda | $88,369 |
Source: Public Records
Tax History
| Year | Tax Paid | Tax Assessment Tax Assessment Total Assessment is a certain percentage of the fair market value that is determined by local assessors to be the total taxable value of land and additions on the property. | Land | Improvement |
|---|---|---|---|---|
| 2025 | $915 | $9,829 | $462 | $9,367 |
| 2024 | $833 | $9,829 | $462 | $9,367 |
| 2023 | $833 | $9,361 | $582 | $8,779 |
| 2022 | $760 | $8,915 | $642 | $8,273 |
| 2021 | $705 | $8,491 | $655 | $7,836 |
| 2020 | $758 | $9,252 | $630 | $8,622 |
| 2019 | $754 | $8,813 | $656 | $8,157 |
| 2018 | $731 | $8,813 | $656 | $8,157 |
| 2017 | $726 | $8,812 | $656 | $8,156 |
| 2016 | $745 | $8,813 | $656 | $8,157 |
| 2015 | $832 | $9,603 | $695 | $8,908 |
| 2014 | $828 | $9,603 | $695 | $8,908 |
Source: Public Records
Map
Nearby Homes
- 1002 E Cherry St
- 112 S Highland Ave
- 915 E Oak St
- 933 E Maple St
- 919 E 2nd St
- 1224 E Cherry St
- 1217 E Cherry St
- 1003 E 4th St
- 732 E Broadway St
- 1301 E Ash St
- 724 E Moses St
- 843 E 4th St
- 708 E Broadway St
- 1318 E Oak St
- 616 E Cherry St
- 612 E 2nd St
- 1236 E Main St
- 822 E 6th St
- 508 S Michigan Ave
- 1001 E Pecan St
- 1010 E Broadway St
- 1004 E Broadway St
- 1016 E Broadway St
- 1009 E Moses St
- 1005 E Moses St
- 944 E Broadway St
- 109 N Wilson Ave
- 1013 E Moses St
- 1020 E Broadway St
- 1019 E Moses St
- 1007 E Broadway St
- 940 E Broadway St
- 1003 E Broadway St
- 1023 E Moses St
- 1021 E Broadway St
- 1025 E Moses St
- 1024 E Broadway St
- 1311 E Moses St
- 945 E Moses St
- 928 E Broadway St
Your Personal Tour Guide
Ask me questions while you tour the home.