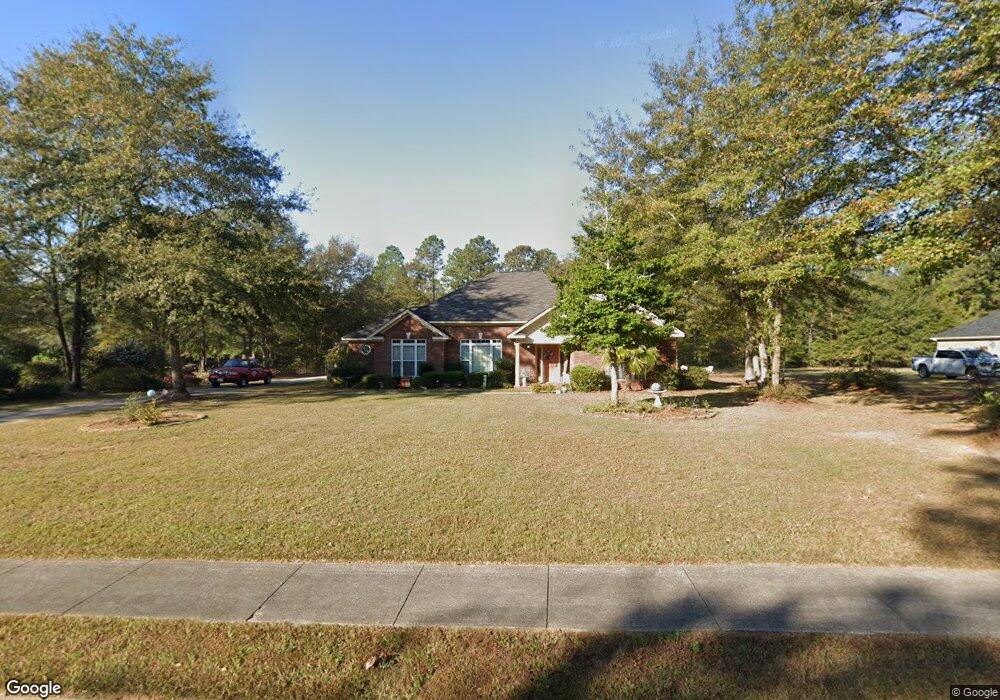
1007 Grindstone Creek Hephzibah, GA 30815
Hancock Mill NeighborhoodEstimated Value: $390,413 - $448,000
4
Beds
4
Baths
2,780
Sq Ft
$155/Sq Ft
Est. Value
About This Home
This home is located at 1007 Grindstone Creek, Hephzibah, GA 30815 and is currently estimated at $429,853, approximately $154 per square foot. 1007 Grindstone Creek is a home located in Richmond County with nearby schools including McBean Elementary School, Pine Hill Middle School, and Johnson Magnet.
Ownership History
Date
Name
Owned For
Owner Type
Purchase Details
Closed on
Jun 30, 2006
Sold by
John C Weaver Homebuilders Inc
Bought by
Callaway Earnest C and Callaway Delpha L
Current Estimated Value
Home Financials for this Owner
Home Financials are based on the most recent Mortgage that was taken out on this home.
Original Mortgage
$231,210
Outstanding Balance
$153,779
Interest Rate
9.05%
Mortgage Type
Purchase Money Mortgage
Estimated Equity
$276,074
Purchase Details
Closed on
Oct 5, 2005
Sold by
Weaver John C and Weaver Sheila T
Bought by
John C Weaver Homebuilders Inc
Home Financials for this Owner
Home Financials are based on the most recent Mortgage that was taken out on this home.
Original Mortgage
$191,900
Interest Rate
5.72%
Mortgage Type
Purchase Money Mortgage
Create a Home Valuation Report for This Property
The Home Valuation Report is an in-depth analysis detailing your home's value as well as a comparison with similar homes in the area
Home Values in the Area
Average Home Value in this Area
Purchase History
| Date | Buyer | Sale Price | Title Company |
|---|---|---|---|
| Callaway Earnest C | $256,900 | None Available | |
| John C Weaver Homebuilders Inc | $30,900 | -- |
Source: Public Records
Mortgage History
| Date | Status | Borrower | Loan Amount |
|---|---|---|---|
| Open | Callaway Earnest C | $231,210 | |
| Previous Owner | John C Weaver Homebuilders Inc | $191,900 |
Source: Public Records
Tax History Compared to Growth
Tax History
| Year | Tax Paid | Tax Assessment Tax Assessment Total Assessment is a certain percentage of the fair market value that is determined by local assessors to be the total taxable value of land and additions on the property. | Land | Improvement |
|---|---|---|---|---|
| 2025 | $1,711 | $157,576 | $14,000 | $143,576 |
| 2024 | $1,711 | $146,188 | $14,000 | $132,188 |
| 2023 | $1,589 | $144,076 | $14,000 | $130,076 |
| 2022 | $1,403 | $102,317 | $14,000 | $88,317 |
| 2021 | $1,519 | $101,704 | $14,000 | $87,704 |
| 2020 | $1,530 | $101,704 | $14,000 | $87,704 |
| 2019 | $1,610 | $101,704 | $14,000 | $87,704 |
| 2018 | $1,620 | $101,704 | $14,000 | $87,704 |
| 2017 | $1,640 | $101,704 | $14,000 | $87,704 |
| 2016 | $1,641 | $101,704 | $14,000 | $87,704 |
| 2015 | $1,641 | $101,704 | $14,000 | $87,704 |
| 2014 | $1,641 | $101,704 | $14,000 | $87,704 |
Source: Public Records
Map
Nearby Homes
- 1027 Grindstone Creek Rd
- 2010 McCoy Mill Rd
- 1515B Hephzibah - McBean Rd
- 1515C Hephzibah - McBean Rd
- 1515D Hephzibah - McBean Rd
- 1515G Hephzibah - McBean Rd
- 1515H Hephzibah - McBean Rd
- 1468 Hephzibah - McBean Rd
- 1515F Hephzibah - McBean Rd
- 4659 Peach Orchard Rd
- 5007 Peach Orchard Rd
- 1436 Hephzibah - McBean Rd Unit 1
- 1436 Hephzibah - McBean Rd
- 5049 Deer Trail Dr
- 109 Loblolly Ln
- 4653 Hunters Mill Ct
- 4924 Old Waynesboro Rd
- 1290 Hephzibah - McBean Rd
- 2073 C Broome Rd
- 102 Antlers Trail
- 1007 Grindstone Cir
- 1009 Grindstone Creek
- 1009 Grindstone Creek Rd
- 1005 Grindstone Creek
- 1011 Grindstone Creek
- 1010 Grindstone Creek
- 2001 McCoys Mill Rd
- 1013 Grindstone Creek
- 1012 Grindstone Cir
- 1012 Grindstone Creek
- 1003 Grindstone Creek
- 1003 Grindstone Creek
- 1004 Grindstone Creek Rd
- 1015 Grindstone Creek
- 1014 Grindstone Creek
- 2003 McCoys Mill Rd
- 1004 Grindstone Creek
- 2003 McCoy Mill Rd
- 2004 McCoys Mill Rd
- 1001 Grindstone Creek Rd