
Seller's Agent in 2015
RJ Cook
RE/MAX REALTY ASSOC-MONTICELLO
(217) 202-5391
27 Total Sales

Estimated Value: $6,814,000
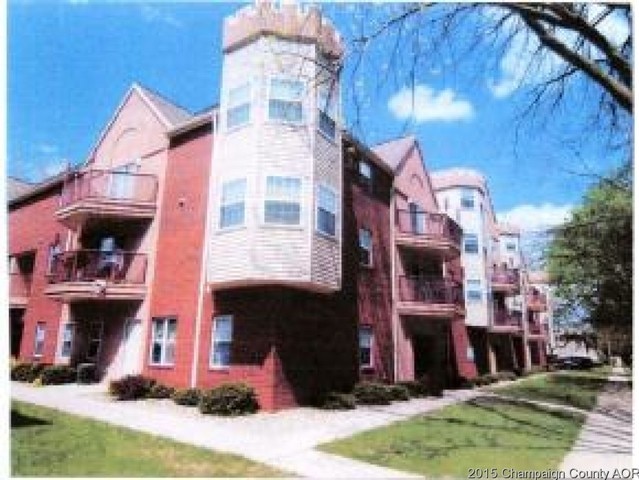
owners are agents A rare opportunity to buy a campus rental property. 100% occupancy since it was built. Plenty of amenities.
Last Agent to Sell the Property
RE/MAX REALTY ASSOC-MONTICELLO License #475136249 Listed on: 03/12/2015
| Date | Buyer | Sale Price | Title Company |
|---|---|---|---|
| Illini Rental Properties Llc | $5,882,000 | None Available | |
| J S J Properties Inc | -- | Attorney |
| Date | Status | Borrower | Loan Amount |
|---|---|---|---|
| Open | Illini Rental Properties Llc | $6,620,000 | |
| Previous Owner | J S J Properties Inc | $2,884,899 |
| Date | Event | Price | List to Sale | Price per Sq Ft |
|---|---|---|---|---|
| 09/03/2015 09/03/15 | Sold | $5,125,000 | -10.1% | -- |
| 07/29/2015 07/29/15 | Pending | -- | -- | -- |
| 03/12/2015 03/12/15 | For Sale | $5,699,000 | -- | -- |
| Year | Tax Paid | Tax Assessment Tax Assessment Total Assessment is a certain percentage of the fair market value that is determined by local assessors to be the total taxable value of land and additions on the property. | Land | Improvement |
|---|---|---|---|---|
| 2024 | $160,018 | $1,592,800 | $338,430 | $1,254,370 |
| 2023 | $160,018 | $1,774,450 | $308,220 | $1,466,230 |
| 2022 | $150,531 | $1,636,950 | $284,340 | $1,352,610 |
| 2021 | $138,600 | $1,514,010 | $262,980 | $1,251,030 |
| 2020 | $132,202 | $1,441,920 | $250,460 | $1,191,460 |
| 2019 | $127,955 | $1,412,260 | $245,310 | $1,166,950 |
| 2018 | $125,081 | $1,390,020 | $241,450 | $1,148,570 |
| 2017 | $125,602 | $1,390,020 | $241,450 | $1,148,570 |
| 2016 | $112,612 | $1,361,430 | $236,480 | $1,124,950 |
| 2015 | $103,598 | $1,337,360 | $232,300 | $1,105,060 |
| 2014 | $102,714 | $1,220,970 | $115,910 | $1,105,060 |
| 2013 | -- | $1,220,970 | $115,910 | $1,105,060 |
Seller's Agent in 2015
RJ Cook
RE/MAX REALTY ASSOC-MONTICELLO
(217) 202-5391
27 Total Sales
Buyer's Agent in 2015
Alex Ruggieri
SVN | North Star
(217) 366-3414
12 Total Sales
Source: Midwest Real Estate Data (MRED)
MLS Number: 09425738
APN: 43-20-13-284-015
Disclaimer: Certain information contained herein is derived from information provided by parties other than Homes.com. All information provided is deemed reliable, but is not guaranteed to be accurate and should be independently verified.
![]() Based on information submitted to the MLS GRID. All data is obtained from various sources and may not have been verified by broker or MLS GRID. Supplied Open House Information is subject to change without notice. All information should be independently reviewed and verified for accuracy. Properties may or may not be listed by the office/agent presenting the information. Some IDX listings have been excluded from this website.
Based on information submitted to the MLS GRID. All data is obtained from various sources and may not have been verified by broker or MLS GRID. Supplied Open House Information is subject to change without notice. All information should be independently reviewed and verified for accuracy. Properties may or may not be listed by the office/agent presenting the information. Some IDX listings have been excluded from this website.
Based on information submitted to the MLS GRID
Ask me questions while you tour the home.