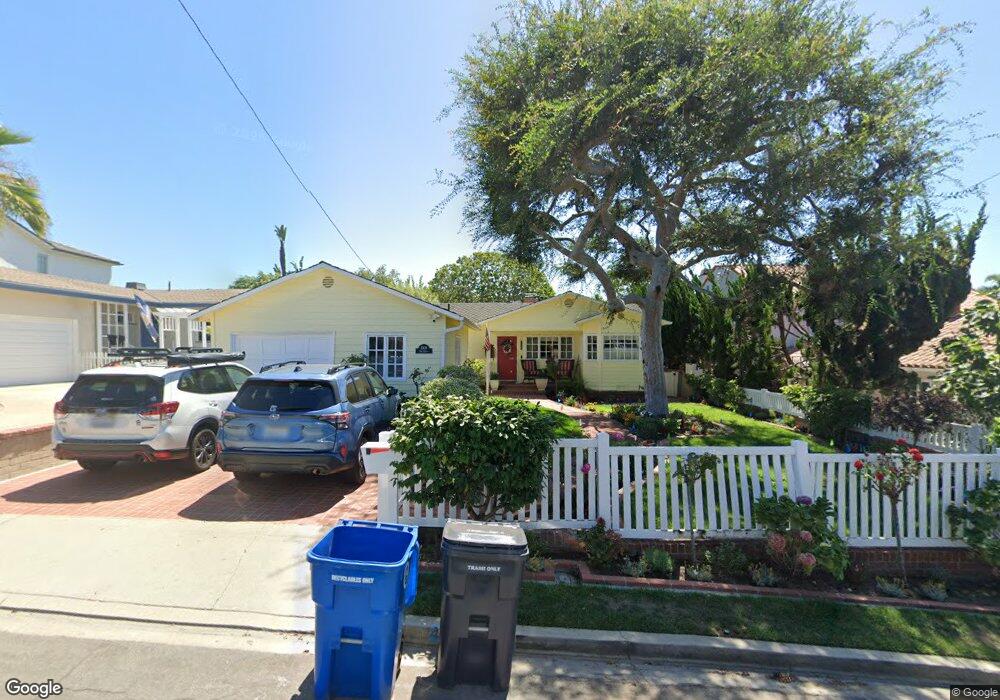
1008 9th St Manhattan Beach, CA 90266
Estimated Value: $2,837,874 - $3,903,000
3
Beds
2
Baths
1,871
Sq Ft
$1,707/Sq Ft
Est. Value
About This Home
This home is located at 1008 9th St, Manhattan Beach, CA 90266 and is currently estimated at $3,192,969, approximately $1,706 per square foot. 1008 9th St is a home located in Los Angeles County with nearby schools including Opal Robinson Elementary School, Manhattan Beach Middle School, and Mira Costa High School.
Ownership History
Date
Name
Owned For
Owner Type
Purchase Details
Closed on
Nov 13, 1998
Sold by
Powell Fay M
Bought by
Powell Bruce W and Powell Fay M
Current Estimated Value
Create a Home Valuation Report for This Property
The Home Valuation Report is an in-depth analysis detailing your home's value as well as a comparison with similar homes in the area
Home Values in the Area
Average Home Value in this Area
Purchase History
| Date | Buyer | Sale Price | Title Company |
|---|---|---|---|
| Powell Bruce W | -- | -- |
Source: Public Records
Tax History
| Year | Tax Paid | Tax Assessment Tax Assessment Total Assessment is a certain percentage of the fair market value that is determined by local assessors to be the total taxable value of land and additions on the property. | Land | Improvement |
|---|---|---|---|---|
| 2025 | $2,025 | $147,722 | $82,837 | $64,885 |
| 2024 | $2,025 | $144,826 | $81,213 | $63,613 |
| 2023 | $1,874 | $141,987 | $79,621 | $62,366 |
| 2022 | $1,845 | $139,204 | $78,060 | $61,144 |
| 2021 | $1,867 | $136,476 | $76,530 | $59,946 |
| 2019 | $1,821 | $132,430 | $74,261 | $58,169 |
| 2018 | $1,723 | $129,834 | $72,805 | $57,029 |
| 2016 | $1,606 | $124,794 | $69,979 | $54,815 |
| 2015 | $1,576 | $122,920 | $68,928 | $53,992 |
| 2014 | $1,567 | $120,513 | $67,578 | $52,935 |
Source: Public Records
Map
Nearby Homes
- 927 9th St
- 1167 Magnolia Ave
- 844 14th St
- 934 1st St
- 947 Manhattan Beach
- 541 4th St
- 207 S Poinsettia Ave
- 912 N Rowell Ave
- 1728 Oak Ave
- 1612 Magnolia Ave
- 215 S Poinsettia Ave
- 1801 Oak Ave
- 1801 Pine Ave
- 1416 Manhattan Beach Blvd
- 620 12th St
- 1140 Fisher Ave
- 628 13th St
- 525 Manhattan Beach Blvd
- 626 Longfellow Ave
- 1450 6th St
Your Personal Tour Guide
Ask me questions while you tour the home.