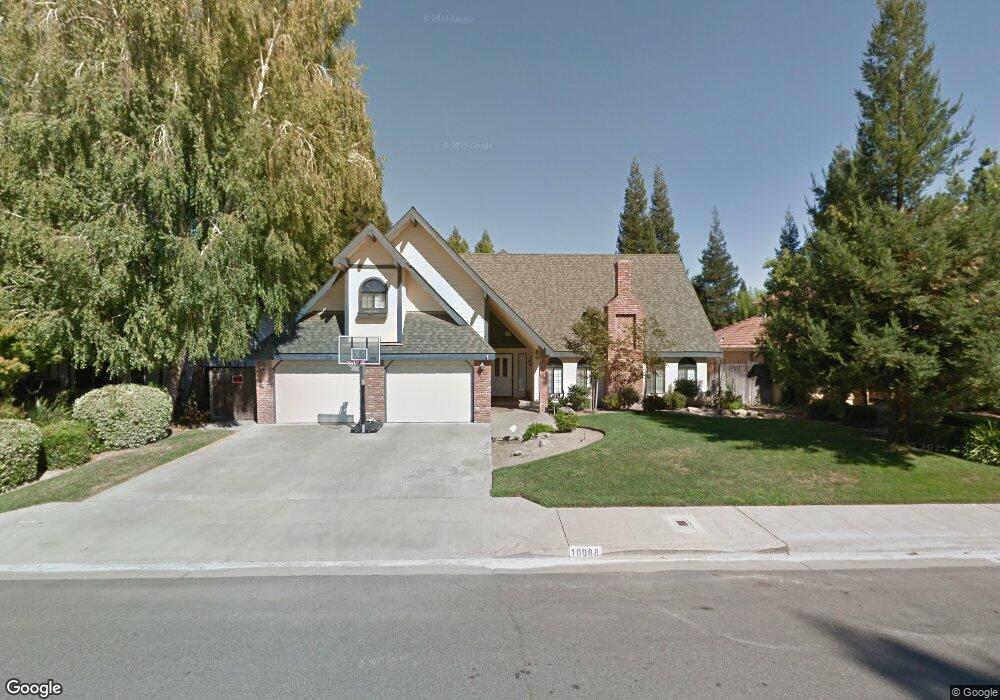
10088 N Pheasant Run Dr Fresno, CA 93730
Woodward Park NeighborhoodEstimated Value: $588,000 - $796,000
5
Beds
3
Baths
2,635
Sq Ft
$265/Sq Ft
Est. Value
About This Home
This home is located at 10088 N Pheasant Run Dr, Fresno, CA 93730 and is currently estimated at $697,083, approximately $264 per square foot. 10088 N Pheasant Run Dr is a home located in Fresno County with nearby schools including Valley Oak Elementary School, Kastner Intermediate School, and Clovis West High School.
Ownership History
Date
Name
Owned For
Owner Type
Purchase Details
Closed on
Aug 23, 2000
Sold by
Gaede Don H
Bought by
Mcdougal John R and Mcdougal Jennifer
Current Estimated Value
Home Financials for this Owner
Home Financials are based on the most recent Mortgage that was taken out on this home.
Original Mortgage
$180,500
Outstanding Balance
$64,338
Interest Rate
7.98%
Estimated Equity
$632,745
Purchase Details
Closed on
Jun 15, 1995
Sold by
Gaede Alison H
Bought by
Gaede Don H
Purchase Details
Closed on
Jan 7, 1995
Sold by
Lemler Gregg L and Lemler Sheree L
Bought by
Gaede Don H
Home Financials for this Owner
Home Financials are based on the most recent Mortgage that was taken out on this home.
Original Mortgage
$142,400
Interest Rate
7.08%
Create a Home Valuation Report for This Property
The Home Valuation Report is an in-depth analysis detailing your home's value as well as a comparison with similar homes in the area
Home Values in the Area
Average Home Value in this Area
Purchase History
| Date | Buyer | Sale Price | Title Company |
|---|---|---|---|
| Mcdougal John R | $190,000 | Fidelity National Title Co | |
| Gaede Don H | -- | Chicago Title Co | |
| Gaede Don H | $178,000 | Chicago Title Co |
Source: Public Records
Mortgage History
| Date | Status | Borrower | Loan Amount |
|---|---|---|---|
| Open | Mcdougal John R | $180,500 | |
| Previous Owner | Gaede Don H | $142,400 |
Source: Public Records
Tax History Compared to Growth
Tax History
| Year | Tax Paid | Tax Assessment Tax Assessment Total Assessment is a certain percentage of the fair market value that is determined by local assessors to be the total taxable value of land and additions on the property. | Land | Improvement |
|---|---|---|---|---|
| 2025 | $4,519 | $386,916 | $108,478 | $278,438 |
| 2023 | $4,431 | $371,893 | $104,266 | $267,627 |
| 2022 | $4,370 | $364,602 | $102,222 | $262,380 |
| 2021 | $4,247 | $357,454 | $100,218 | $257,236 |
| 2020 | $4,024 | $336,964 | $99,191 | $237,773 |
| 2019 | $3,945 | $330,358 | $97,247 | $233,111 |
| 2018 | $3,857 | $323,882 | $95,341 | $228,541 |
| 2017 | $3,790 | $317,532 | $93,472 | $224,060 |
| 2016 | $3,661 | $311,307 | $91,640 | $219,667 |
| 2015 | $3,604 | $306,632 | $90,264 | $216,368 |
| 2014 | $3,536 | $300,626 | $88,496 | $212,130 |
Source: Public Records
Map
Nearby Homes
- 656 E Teal Cir
- 640 E Pintail Cir
- 609 E Teal Cir
- 761 E Wood Duck Cir
- 534 E Mariners Cir
- 645 E Champlain Dr Unit 123
- 585 E Chesapeake Cir
- 876 E Sutton Dr
- 787 E Buckhill Rd
- 793 E Buckhill Rd
- 10130 N Heather Dr
- 10250 N Quail Run Dr
- 841 E Country View Cir
- 843 E Country View Cir
- 10111 N Spanish Bay Dr
- 851 E Country View Cir
- 1017 E Democracy Ave
- 8701 Highway 41 Unit 54
- 8701 Highway 41 Unit 44
- 8701 Highway 41 Unit 36
- 10076 N Pheasant Run Dr
- 10104 N Pheasant Run Dr
- 10064 N Pheasant Run Dr
- 10116 N Pheasant Run Dr
- 397 E Sandpiper Ct
- 396 E Pelican Ct
- 585 E Shelldrake Cir
- 10052 N Pheasant Run Dr
- 10128 N Pheasant Run Dr
- 577 E Shelldrake Cir
- 389 E Sandpiper Ct
- 398 E Sandpiper Ct
- 589 E Shelldrake Cir
- 386 E Pelican Ct
- 10040 N Pheasant Run Dr
- 392 E Sandpiper Ct
- 593 E Shelldrake Cir
- 573 E Shelldrake Cir
- 395 E Pelican Ct
- 377 E Sandpiper Ct