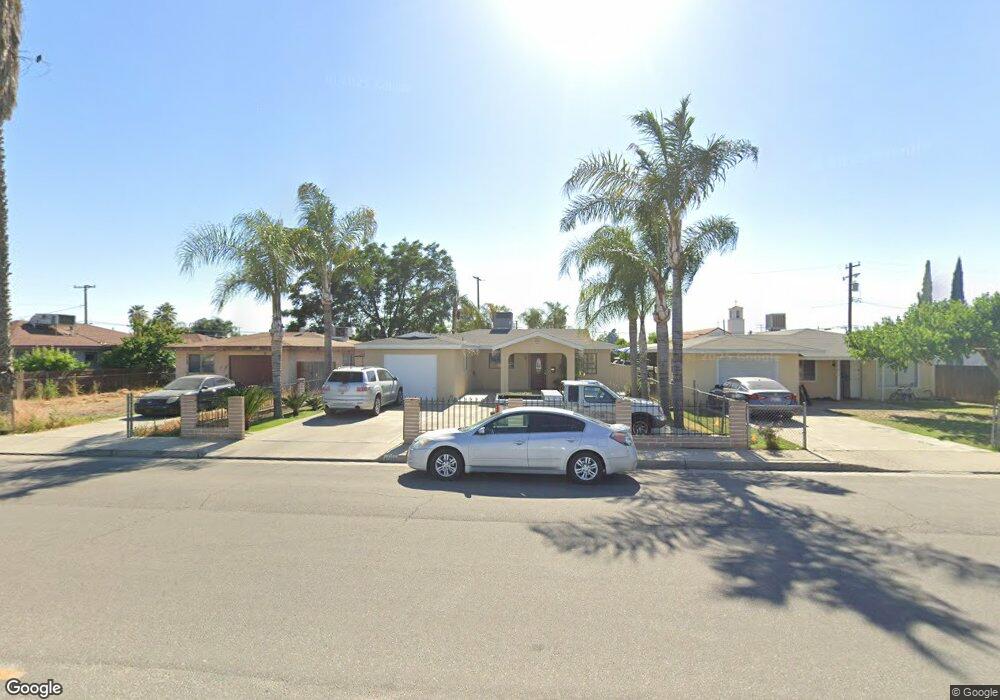
1009 Dover St Delano, CA 93215
West Delano NeighborhoodEstimated Value: $274,000 - $355,000
4
Beds
3
Baths
1,080
Sq Ft
$281/Sq Ft
Est. Value
About This Home
This home is located at 1009 Dover St, Delano, CA 93215 and is currently estimated at $303,192, approximately $280 per square foot. 1009 Dover St is a home located in Kern County with nearby schools including Fremont Elementary School, Almond Tree Middle School, and Cesar E. Chavez High School.
Ownership History
Date
Name
Owned For
Owner Type
Purchase Details
Closed on
Mar 11, 2005
Sold by
Guzman Segura Jose L and Ceja Guzman Emilia
Bought by
Guzman Segura Jose L and Ceja Guzman Emilia
Current Estimated Value
Home Financials for this Owner
Home Financials are based on the most recent Mortgage that was taken out on this home.
Original Mortgage
$88,000
Interest Rate
5.53%
Mortgage Type
New Conventional
Purchase Details
Closed on
Nov 6, 2003
Sold by
Guzman Francisco F and Guzman Maria Isabel
Bought by
Segura Jose Luis Guzman and Ceja Emilia Ceja
Purchase Details
Closed on
Feb 12, 1997
Sold by
Ortiz Felix and Ortiz Phyllis
Bought by
Guzman Francisco F and Guzman Maria Isabel
Home Financials for this Owner
Home Financials are based on the most recent Mortgage that was taken out on this home.
Original Mortgage
$86,861
Interest Rate
8.15%
Mortgage Type
FHA
Create a Home Valuation Report for This Property
The Home Valuation Report is an in-depth analysis detailing your home's value as well as a comparison with similar homes in the area
Home Values in the Area
Average Home Value in this Area
Purchase History
| Date | Buyer | Sale Price | Title Company |
|---|---|---|---|
| Guzman Segura Jose L | -- | Chicago Title Company | |
| Segura Jose Luis Guzman | -- | -- | |
| Guzman Francisco F | $87,000 | Fidelity National Title Co |
Source: Public Records
Mortgage History
| Date | Status | Borrower | Loan Amount |
|---|---|---|---|
| Closed | Guzman Segura Jose L | $88,000 | |
| Previous Owner | Guzman Francisco F | $86,861 |
Source: Public Records
Tax History
| Year | Tax Paid | Tax Assessment Tax Assessment Total Assessment is a certain percentage of the fair market value that is determined by local assessors to be the total taxable value of land and additions on the property. | Land | Improvement |
|---|---|---|---|---|
| 2025 | $1,650 | $141,668 | $24,414 | $117,254 |
| 2024 | $1,679 | $138,891 | $23,936 | $114,955 |
| 2023 | $1,679 | $136,168 | $23,467 | $112,701 |
| 2022 | $1,651 | $133,499 | $23,007 | $110,492 |
| 2021 | $1,581 | $130,882 | $22,556 | $108,326 |
| 2020 | $1,577 | $129,541 | $22,325 | $107,216 |
| 2019 | $1,550 | $129,541 | $22,325 | $107,216 |
| 2018 | $1,530 | $124,512 | $21,459 | $103,053 |
| 2017 | $1,540 | $122,072 | $21,039 | $101,033 |
| 2016 | $1,515 | $119,679 | $20,627 | $99,052 |
| 2015 | $1,566 | $117,883 | $20,318 | $97,565 |
| 2014 | $1,462 | $115,574 | $19,920 | $95,654 |
Source: Public Records
Map
Nearby Homes
Your Personal Tour Guide
Ask me questions while you tour the home.